The Yen Tsunami

Disclaimer: Your capital is at risk. This is not investment advice.
The event of the week in markets, other than the surge in Chinese stocks, was the sharp reversal in the yen. Normally, the yen lives a quiet life and rarely makes the headlines, but this week, it was all changed, with commentators lining up to condemn it. I take a different view and deem the yen to be deeply undervalued and a portfolio hedge. That is, when things go wrong in financial markets, the yen will rise, just as it did in 2008, only this time, even more so. Has the rally just begun?
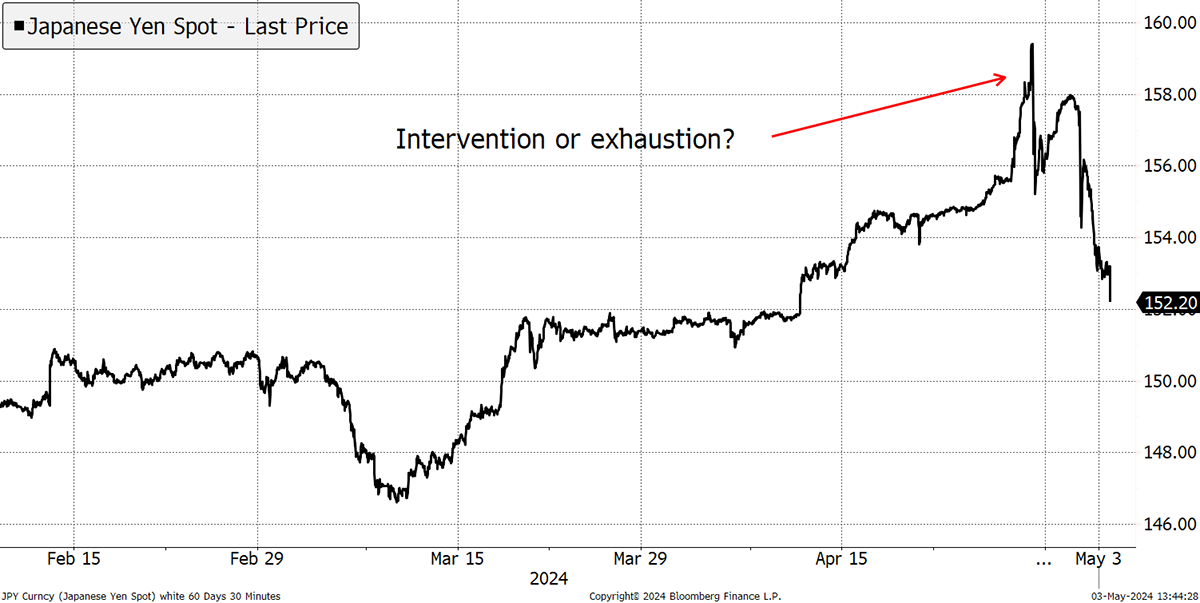
Since mid-March, the yen has been sliding, which means the dollar has been rising against the yen, as shown. After a tense few days, the dollar-yen chart surged on Friday, 26 April, leaving the market wondering if the Bank of Japan would intervene. But Monday was Showa Day, a public holiday to honour Emperor Showa Hirohito. Whether they intervened or not, the emperor wasn’t having it, and there was a sharp reversal, which brought back memories of the Truss/Kwarteng mini budget on the Pound in late 2022.
Yen Reversal
Going back to 1970, a dollar once bought 350 yen, and less than half that today. The current level of the yen is the same as it was in 1990. Coincidentally, that was when the Japanese stockmarket made up half of the world index, a good sign of a bubble. Today, the yen is back at that level, having visited 76 along the way. I show the Nikkei in dollars below in red. Notice how this is hovering around the 1990 all-time high for the Nikkei when priced in US dollars.
The Yen and the Nikkei
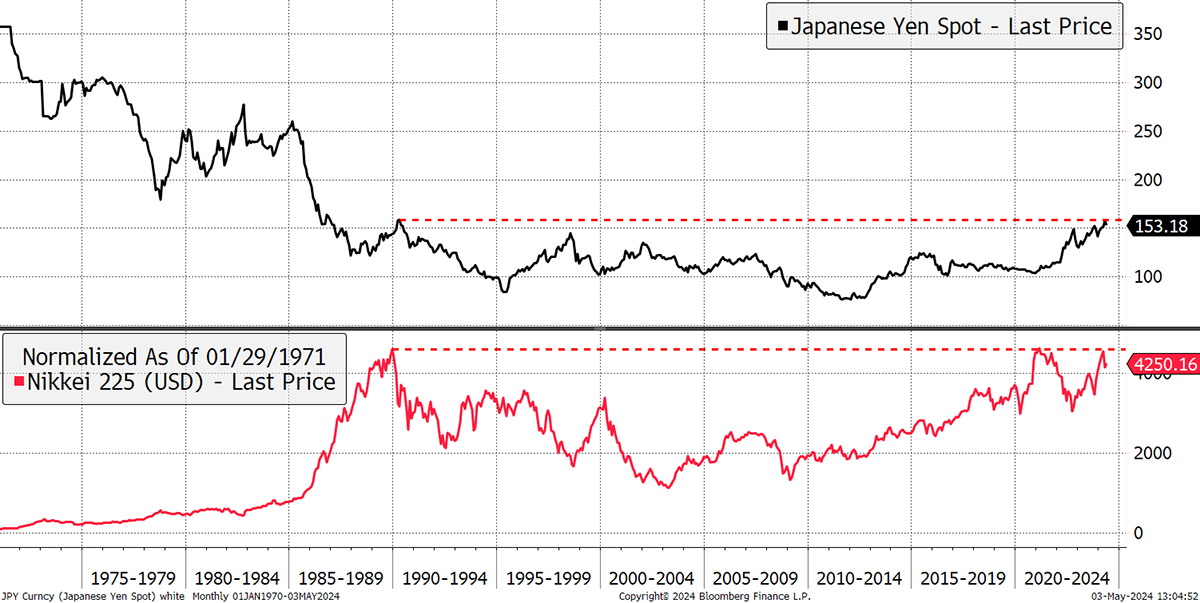
The Nikkei in yen starts at $100 on the chart in 1970. It rises to $4,250 by 1990, in just 20 years, and is still there 34 years later. This is how long it can take for serious asset bubbles, like Japan in 1990, to clear.
The reason behind the slump in the yen has been the continued low-interest rate when most countries have hiked. But being an efficient economy, inflation has remained ultra-low for years, and by global standards, still is. Since 1990, Japanese inflation has averaged 0.5% in contrast to 2.7% in the USA. That difference drives purchasing power parity (PPP), which has driven the fundamental value of the yen much higher (which is lower on the chart). According to PPP, the yen is worth 73.5 when it trades at 153.
Cheap Yen
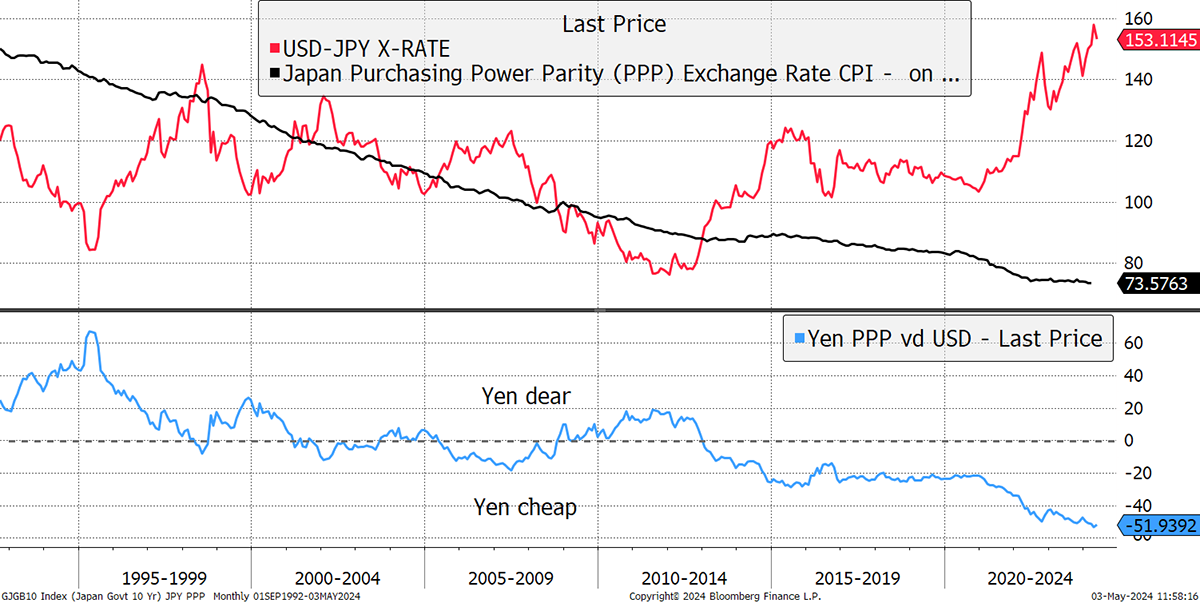
If you doubt PPP, Japan has always been deemed to be an expensive place to visit, rather like Switzerland. Yet today, it is cheap to visit Japan, and the result has been a tourism boom. That’s circumstantial evidence that the yen is undervalued, as PPP suggests. But be sure that PPP can be misaligned for years before it reverts… but it always gets there in the end.
The cause of the undervalued yen has been the interest rate differential between the US/world and Japan, which remains wide. That is true, and low rates attract borrowers who have chosen the yen over other currencies because it is so cheap to do so. This is known as the carry trade. When you borrow the yen, you go short as you sell the yen. When you repay, you have to buy back the yen to cover that position.
Many are saying that Japan cannot afford to raise interest rates, which would unwind the carry trade, because it has too much debt, but unlike many indebted countries, Japan largely owes it to herself. They also sit on over a trillion dollars of foreign reserves, and in yen terms, those have recently surged.
The level of the outstanding carry trade is shown by the investor positions on currency forwards. This is now as short as it has ever been, meaning that the amount of yen borrowed is extreme. When they repay it, possibly by force in a financial crisis, the yen will surge. It is hugely risky to continue to short the yen now that it has become a very crowded trade.
Speculators Are Heavily Short the Yen
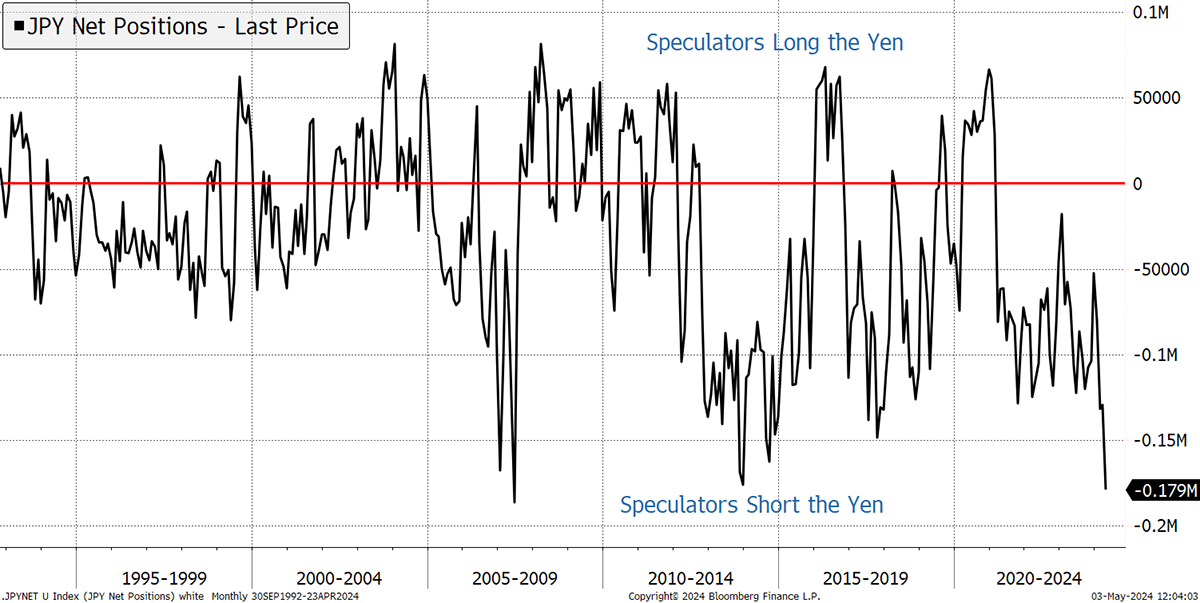
We were last here in 2007, and, to a lesser extent, in 2014. In 2007, the dollar-yen fell from 120 to 80 by 2012, sailing through the credit crisis. In 2014, it was less notable, but the yen headed back towards 100.
It never ceases to amaze me how these trends can go on for so long, against clear valuation divergences. It’s a question investors need to ask not just with the yen, but with value in general. The world remains awash with value, and my job is to find it.
A Week at ByteTree
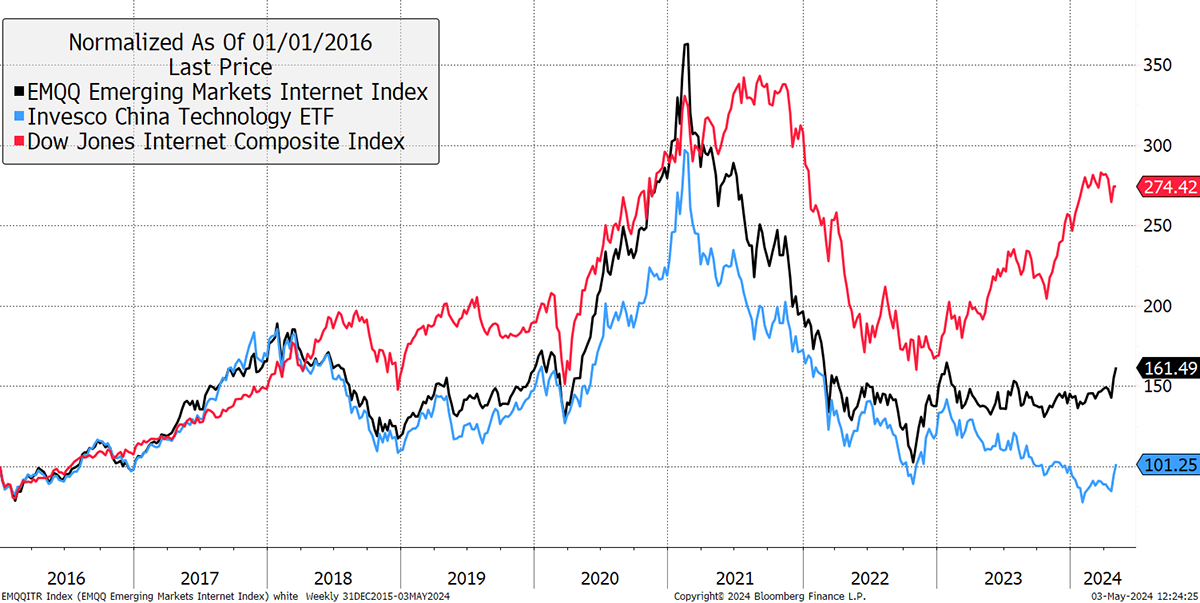
I have been keeping a close eye on Hong Kong and China, particularly the internet stocks, which offer compelling value. The performance divergence between Emerging Market Internet (EMQQ), which I covered in The Multi Asset Investor, and US tech stocks has been extraordinary. Despite faster growth in the emerging markets, US internet stocks fell less in 2022 and have rallied further since. It is an anomaly, and with the worst of the China-related geopolitical news digested, my simple thesis is that it’s catch-up time.
Global Internet Stocks
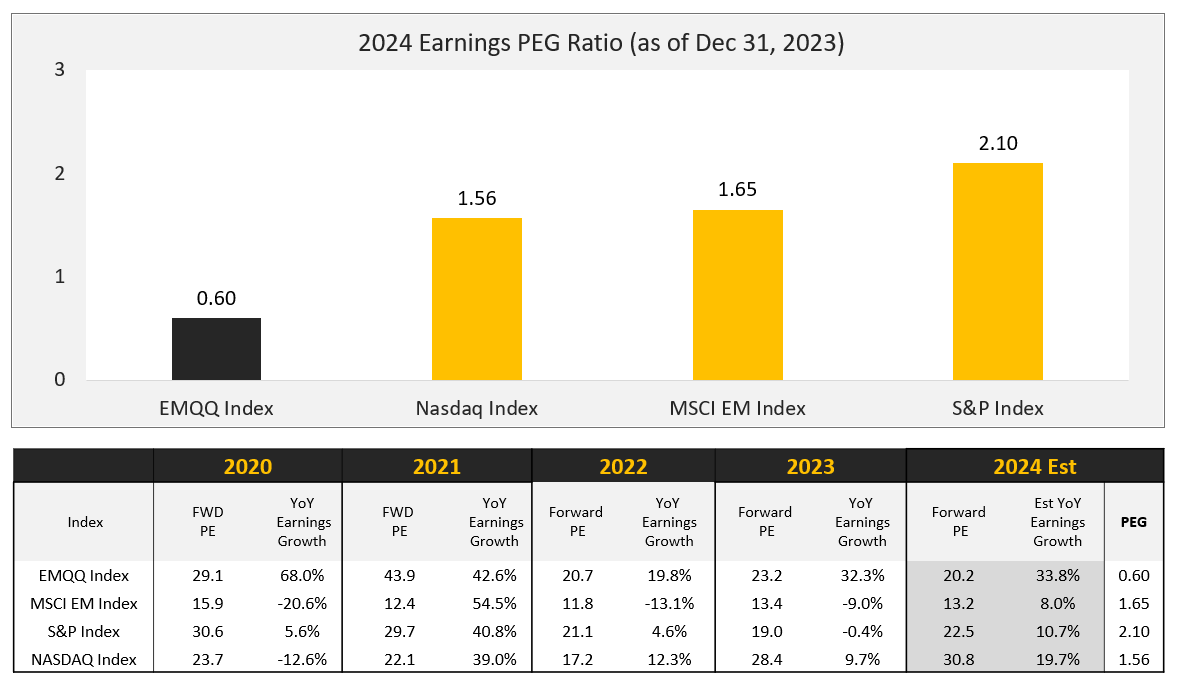
The valuation gap is extraordinary. The PEs and growth rates show consistent higher growth, with lower valuations. On the right, the PEG ratio, the PE divided by the growth rate, is 0.6x, which is a bargain. Compare that to the S&P 500 with a PEG of 2.1x, which is extortionate.
On Monday, I had the opportunity to talk to Kevin Carter, Founder and CIO of EMQQ, where he shared his thoughts on EMQQ and the current situation. We discussed some of the problems the index has faced, such as the pulled IPO of Jack Ma’s Alipay in 2021, and the war, which saw Russian stocks marked to zero. These have proven to be minor setbacks, and EMQQ is a fascinating investment theme that seems to have been overlooked by the market. I believe that investors will come to realise that the world has changed. China and India are great powers, and, like it or loathe it, their progress is inevitable and unstoppable. Watch the recording here.
In Venture, I followed up with a Chinese internet stock, and I hope more will follow in due course.
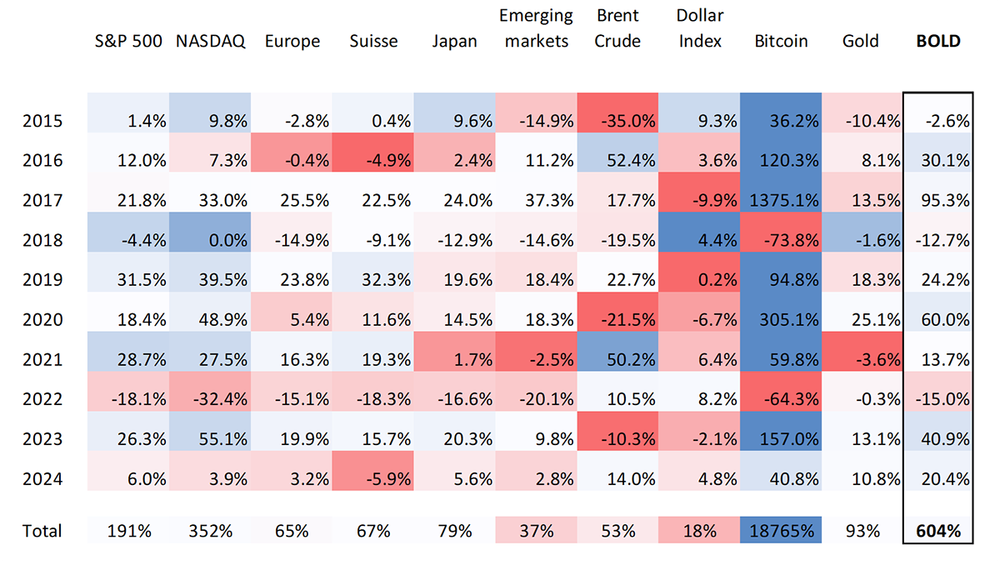
On May Day, the BOLD Index (Bitcoin and Gold risk-weighted) was rebalanced with 24.8% in Bitcoin and 75.1% in Gold. Notice how Bitcoin has been a high-return asset, and often the best of the year and sometimes the worst. Gold, on the other hand, is more stable and, best of all, counter-cyclical with Bitcoin. The best part about the BOLD combination is that it is so dependable, as it has never been the best or the worst, just consistent.
Asset Class Returns
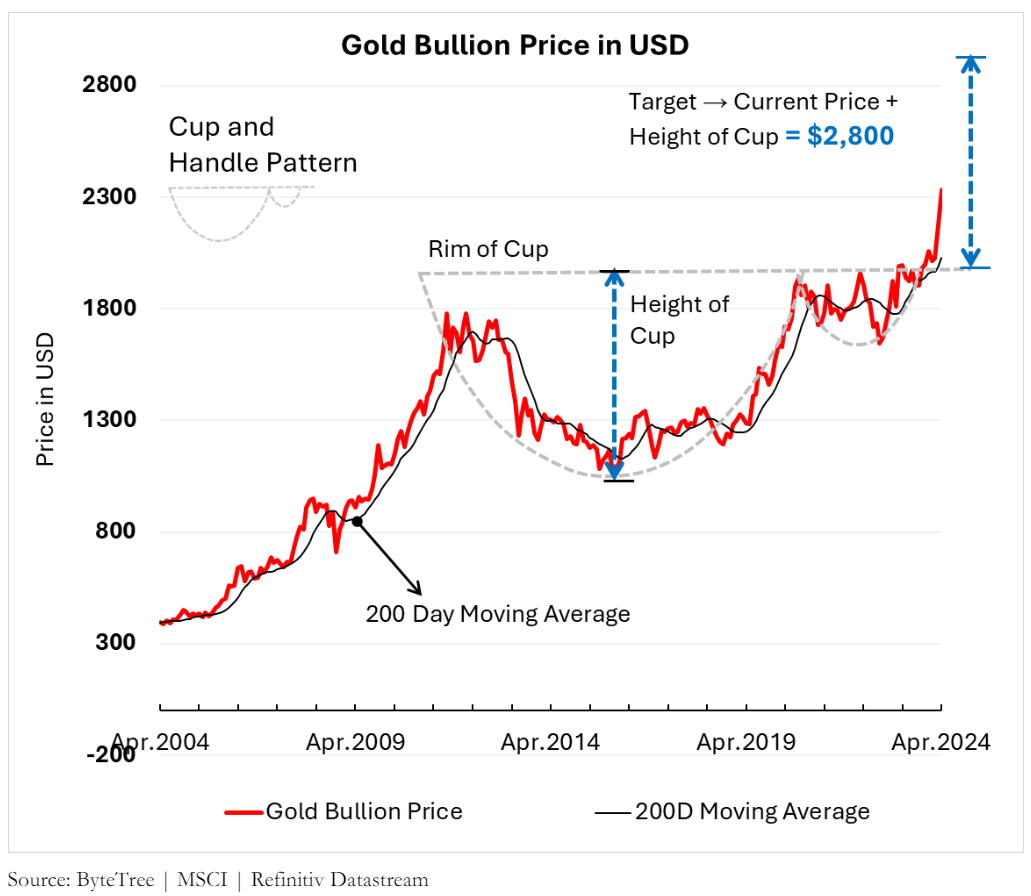
In April Showers, the Adaptive Asset Allocation Report came through banging the drum for higher metal prices, both precious and industrial. I agree and could barely contain myself when they published this chart.
Finally, in crypto, Ali looked at Stripe’s announcement that they would incorporate crypto payments, which is a big deal as they process 1% of global GDP. There was also coverage of UK legislation that makes it easier for the law to confiscate your assets. Can the next government be any worse?
Due to the UK bank holiday on Monday, ByteFolio and The Multi-Asset Investor will be delayed by a day.
Have a great weekend,
Charlie Morris
Founder, ByteTree