Bitcoin Loves Hot Money

Disclaimer: Your capital is at risk. This is not investment advice.
ATOMIC 98;
In both 2014 and 2018/9, we saw rates and inflation turn down, coinciding with a period of Bitcoin weakness. When the reading went negative in March 2020, Bitcoin crashed, just as it did in November 2014. The 2020 bull market followed rates and inflation higher until early 2022, when the situation had stabilised. Now the hot money is falling again, from very high levels. If you believe that inflation is contained and rates are headed back to the floor, then Bitcoin is in for a rough ride.
ByteTree ATOMIC
Analysis of Technical, On-chain, Macro, Investment Flows and Crypto Stocks.
Highlights
| Macro | Bitcoin Loves Hot Money |
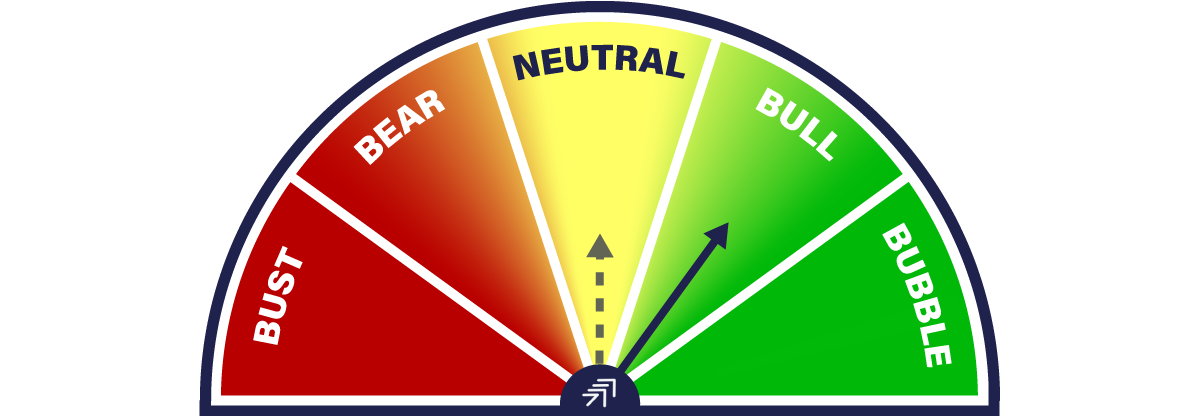
| Technicals | Neutral |
| On-chain | Bear |
| Investment Flows | Neutral |
| BOLD | Kicking Ass |
As a break from the usual, I will lead with the macro because Bitcoin has retraced 25% in gold (18% in dollars). Bitcoin is still in an uptrend, but there’s a lower high (red) as 1 BTC drops to 26.5 ounces of gold.
Bitcoin in Gold
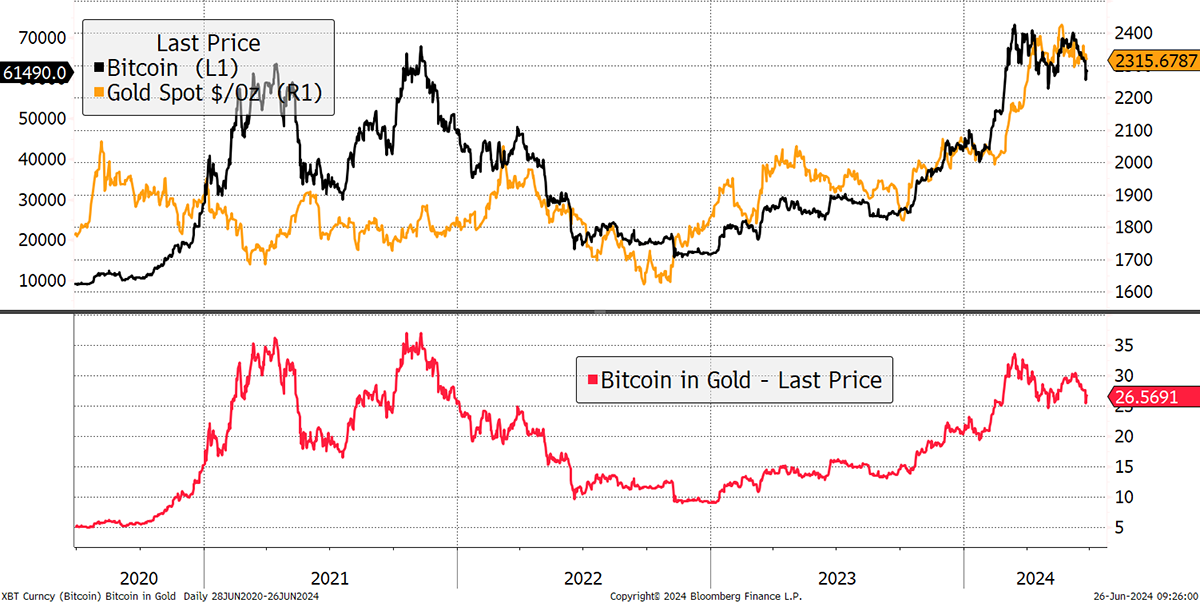
Some would say the correlation between Bitcoin and gold has picked up, but it hasn’t, as they continue to move in opposite directions day by day. They remain fundamentally different assets.
What has caused digital gold to turn down, while yellow gold has remained firm? I have a few explanations, but the important one is the world is running out of money, and Bitcoin loves money, especially when it’s hot money.
Macro - Bitcoin Loves Hot Money
The Money Map, which I often refer to in The Multi-Asset Investor, explains the regime that fits the asset classes. Bonds and equities like low inflation, as they are financial assets, and do well when fiat money is holding up. In contrast, Bitcoin and gold like inflation higher, as they become stores of value during periods of fiat debasement. But as we move to the x-axis, Bitcoin and gold differ. Bitcoin likes rising rates because that happens when the world is awash with cash and the economy is growing. In contrast, gold likes the economy when it’s weak and rates are falling.
The Money Map
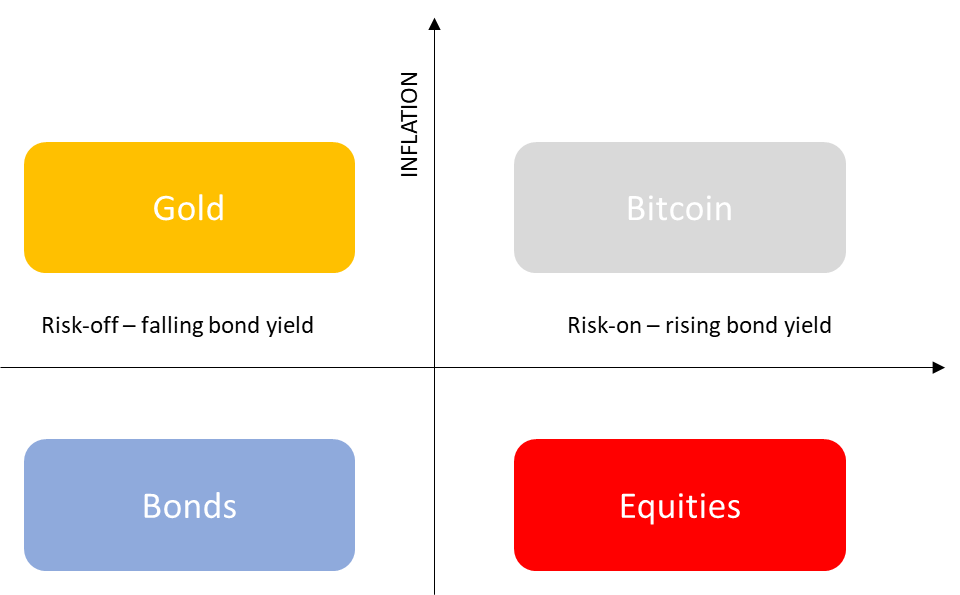
I repeat this because many investors seem to think that Bitcoin likes rates to fall, whereas this thesis suggests it wants them to rise. There’s one other difference between what ATOMIC believes about Bitcoin and mainstream opinion. Bitcoin is much more sensitive to short-term rates, whereas gold is linked to long-term rates.
To illustrate this on Bitcoin, the two-year US bond yield (black) is added to two-year inflation expectations (blue), which becomes a sort of hot money index (red). In simple terms, the higher rates and inflation are, the more money there is in the system. The chart starts in 2005 to illustrate the freezing of the economy in the 2008 credit crisis, and the buoyancy beforehand.
Hot Money Using Two-Year Rates and Inflation
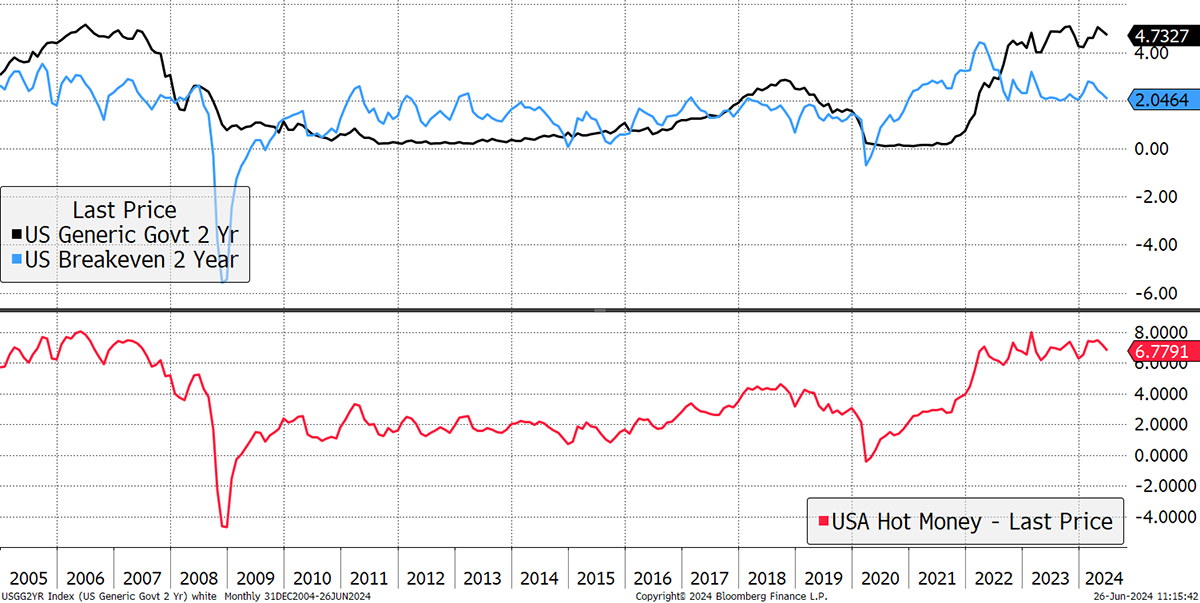
I will next overlay the hot money with Bitcoin. The link is imperfect, as there are many other influencing factors that matter, but it’s pretty clear there’s a link. The blue boxes highlight Bitcoin bull markets, which have tended to coincide with the amount of hot money in the financial system.
Bitcoin and Hot Money
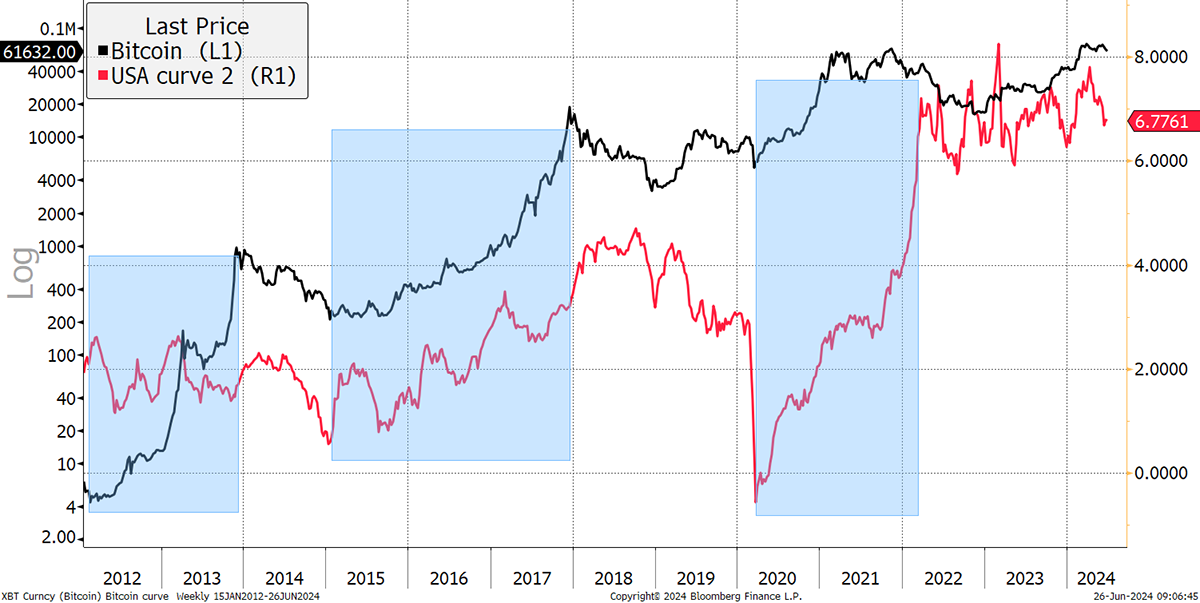
Even more impressive are the links with Bitcoin bear markets. In both 2014 and 2018/9, we saw rates and inflation turn down, coinciding with a period of Bitcoin weakness. When the reading went negative in March 2020, Bitcoin crashed, just as it did in November 2014. The 2020 bull market followed rates and inflation higher until early 2022 when the situation had stabilised. Now the hot money is falling again, from very high levels. If you believe that inflation is contained and rates are headed back to the floor, then Bitcoin is in for a rough ride.
I don’t.
Canada cut rates last month as they felt the inflation battle had been won as it fell to 2.3%. Then inflation was published yesterday at 2.6% for the year and 0.6% for the month. There’s a chance they have moved to cut too early. But then, the developed economies can’t afford high interest rates for much longer, and so the system will force cuts, which will allow inflation to resume. The hot money indicator can remain still with lower rates, provided higher inflation can offset it.
This all comes back to the economy and nominal GDP growth. The economist Knut Wicksell suggested that interest rates should approximate the level of nominal GDP growth (real growth and inflation). This idea is linked and is something we see routinely in the emerging markets whereby rates and inflation remain structurally higher than in developed markets. I do not see how such an environment could be bad for Bitcoin.
Technicals
Yet the trend has weakened, as I have highlighted for the past two weeks in ByteFolio. The price is hovering around the 200-day moving average, which is close to a support level. We cannot ignore the failure to make a new high after March. There were four attempts and they all failed.
Bitcoin 2/5 trend score
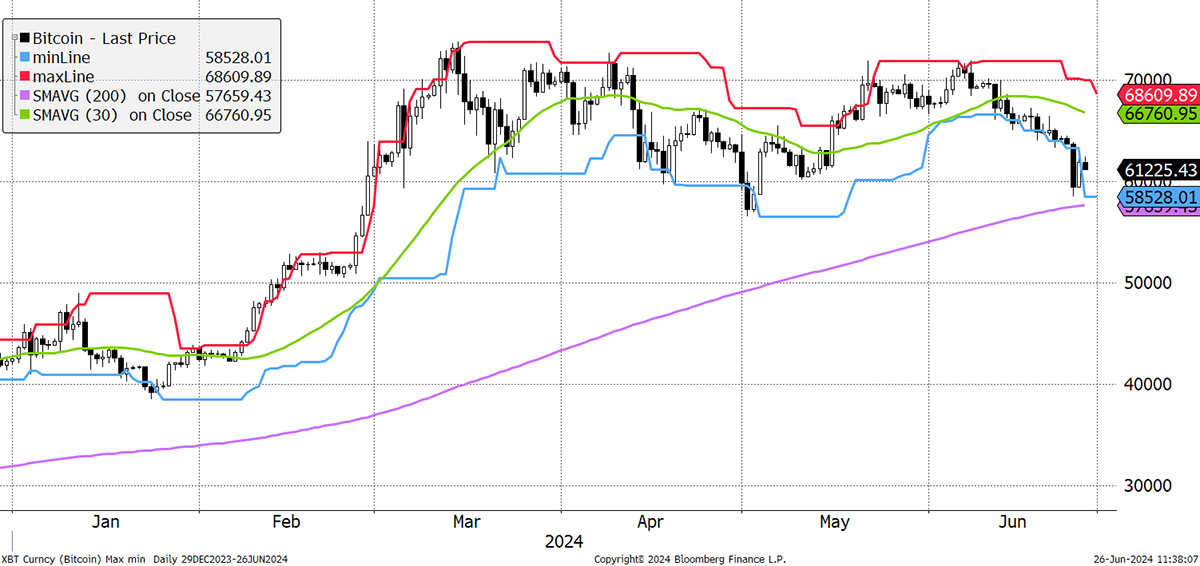
The $60k zone ought to hold, but it doesn’t have to. It could well be an early warning for markets in general. Bitcoin has historically been a useful leading indicator.
Then there’s the divergence with the Mag 7 stocks (NVDA, AAPL, etc.). The correlation is clear, yet Bitcoin has turned down. More importantly, and notwithstanding the leading indicator possibility, the lower blue line is half the level it was in 2021 when Bitcoin was last riding high.
Bitcoin and the Magnificent Seven
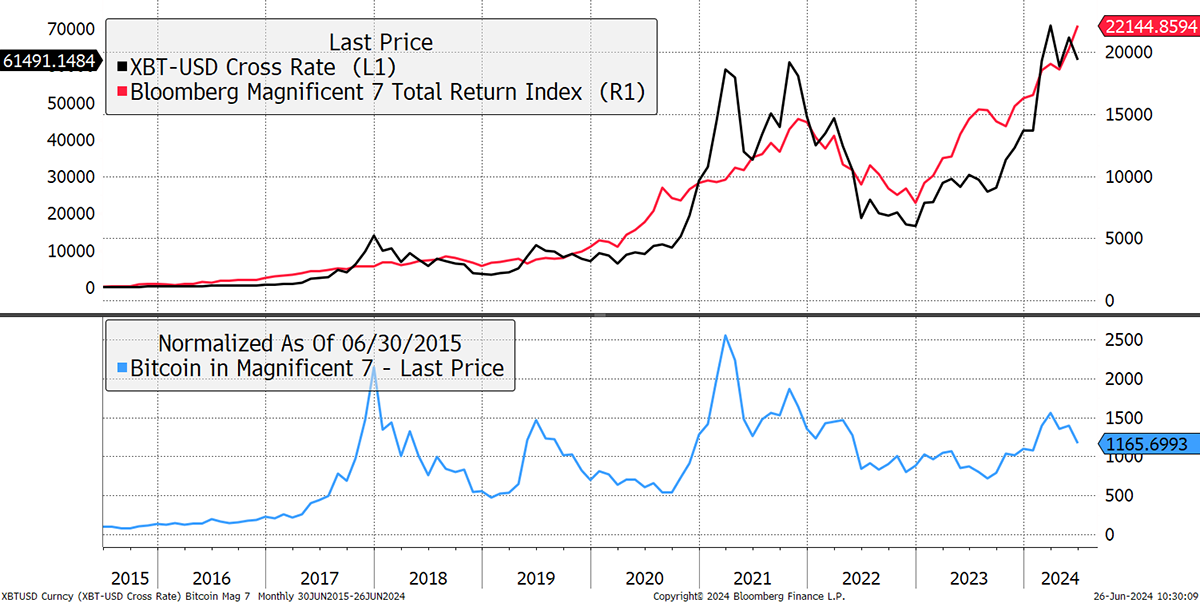
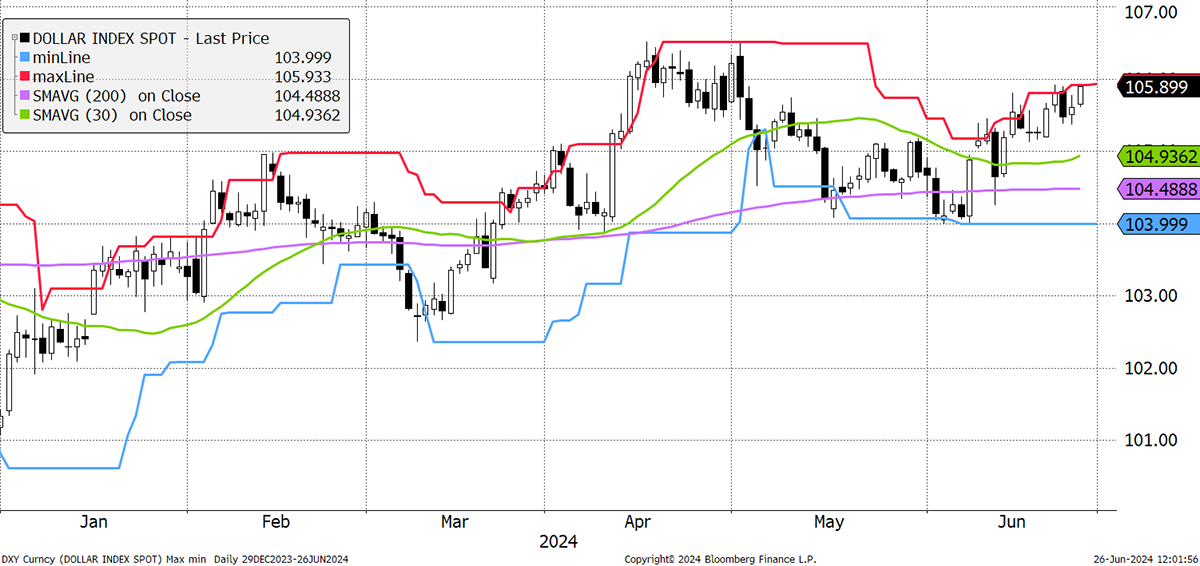
Is that a tough comparison? Potentially. We shouldn’t be concerned about the lag because AI currently has the spotlight while Bitcoin is back in the shadows. That will change, but perhaps not for a while. We should also consider the dollar, which is shown inverted in the chart below. A strong dollar has been bad news for Bitcoin.
Bitcoin and the Dollar
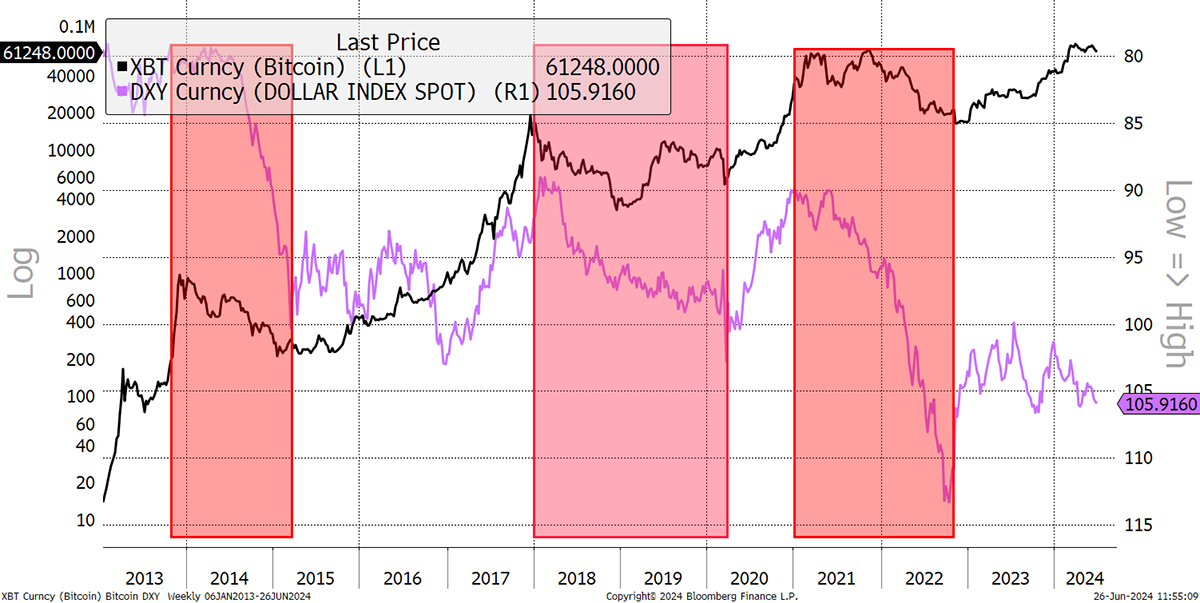
And we have a strong dollar. The trends are positive and a break higher could happen at any time.
Dollar Index 5/5 trend score
Investment Flows
The super-strong flows in February and March, caused by the new ETFs, are over. There was another brave effort recently, but that’s over too. The Bitcoin network is currently seeing modest outflows.
Bitcoin Held by ETFs
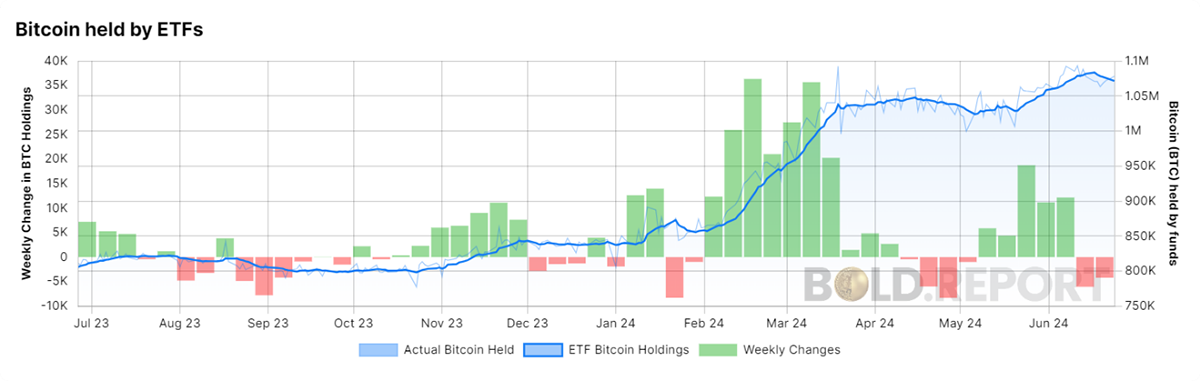
That can be confirmed because just as Bitcoin and Gold have low price correlation, so do the flows it seems. As investors face lower rates, they have stopped selling the gold ETFs and are starting to allocate. It will be interesting to watch these flows battle it out.
Gold Held by ETFs
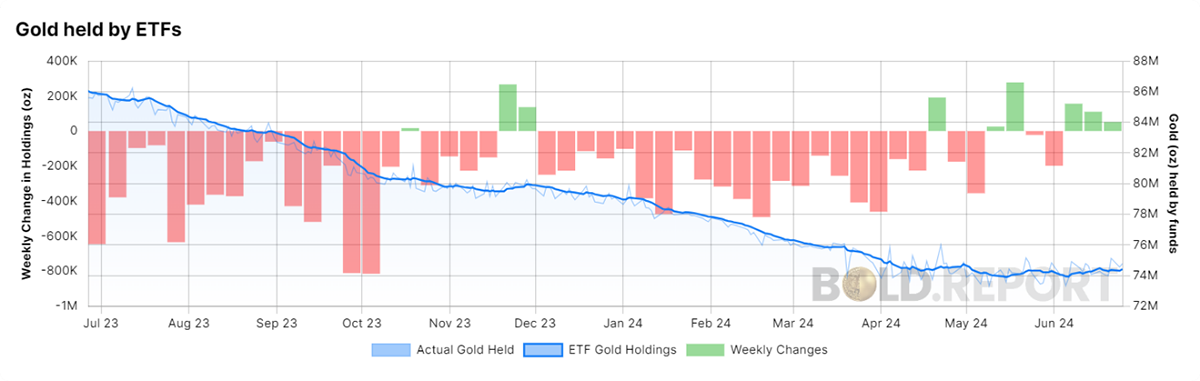
Most importantly, the flows into the Bitcoin ETFs have been dominated by hedge funds, private investors and family offices. There are few institutional investors active in the Bitcoin world. Contrast that with gold, which is dominated by institutional investors. I show the top 20 holders of the iShares Gold ETF alongside the iShares Bitcoin ETF to illustrate the point.
| iShares Gold (IAU) | iShares Bitcoin (IBIT) |
|---|---|
| Bank of America Corp | Millennium Management LLC/NY |
| FMR LLC | Schonfeld Strategic Advisors LLC |
| Morgan Stanley | Aristeia Capital LLC |
| Sumitomo Mitsui Trust Holdings Inc | Boothbay Fund Management LLC |
| Charles Schwab Corp/The | Bracebridge Capital LLC |
| Empower Advisory Group LLC | State of Wisconsin Investment Boar |
| Wells Fargo & Co | Graham Capital Management LP |
| JPMorgan Chase & Co | Pine Ridge Advisers LLC |
| AllianceBernstein Holding LP | Rubric Capital Management LP |
| LPL Financial LLC | Titan Global Capital Management US |
| Mizuho Financial Group Inc | Symmetry Investments LP |
| Bank of Montreal | Pinpoint Asset Management Ltd |
| Ameriprise Financial Inc | Fortress Investment Group LLC |
| WealthNavi Inc | Sculptor Capital Management Inc |
| Raymond James Financial Inc | Yong Rong HK Asset Management Ltd |
| Northwestern Mutual Wealth Mgmt | Murchinson Ltd |
| HighTower Advisors LLC | Alyeska Investment Group LP |
| Genstar Capital LLC | Horizon Kinetics LLC |
| Packer & Co Ltd | CTC ALTERNATIVE STRATEGIES LTD |
| BlackRock Inc | Maplelane Capital LLC |
Source: Bloomberg
It really brings it home how the Bitcoin ETF owners are nothing like the gold ETF holders, who are basically the financial establishment. In contrast, the Bitcoin ETF owners are the financial hooligans. The long-term bull case for Bitcoin will be done when these lists match!
On-chain
The Bitcoin Network Demand Model scores 0/4, which is cool compared to last month's reading. It’s bad news on the blockchain as transaction activity slows. The level of fees is easing back, which reiterates lower transactional activity.
Weekly Bitcoin Fees in USD
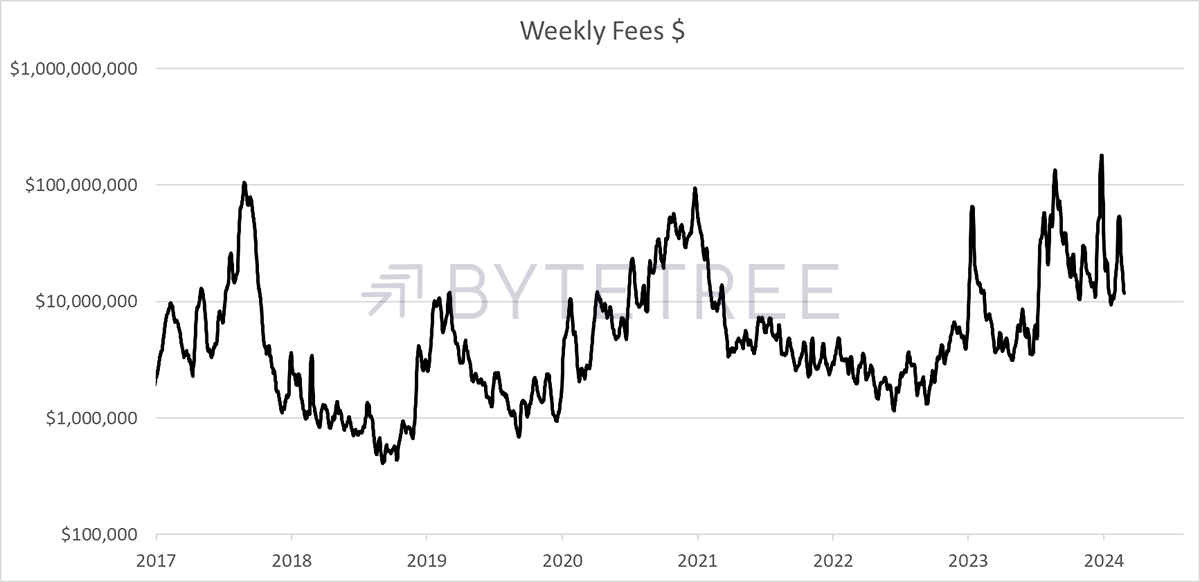
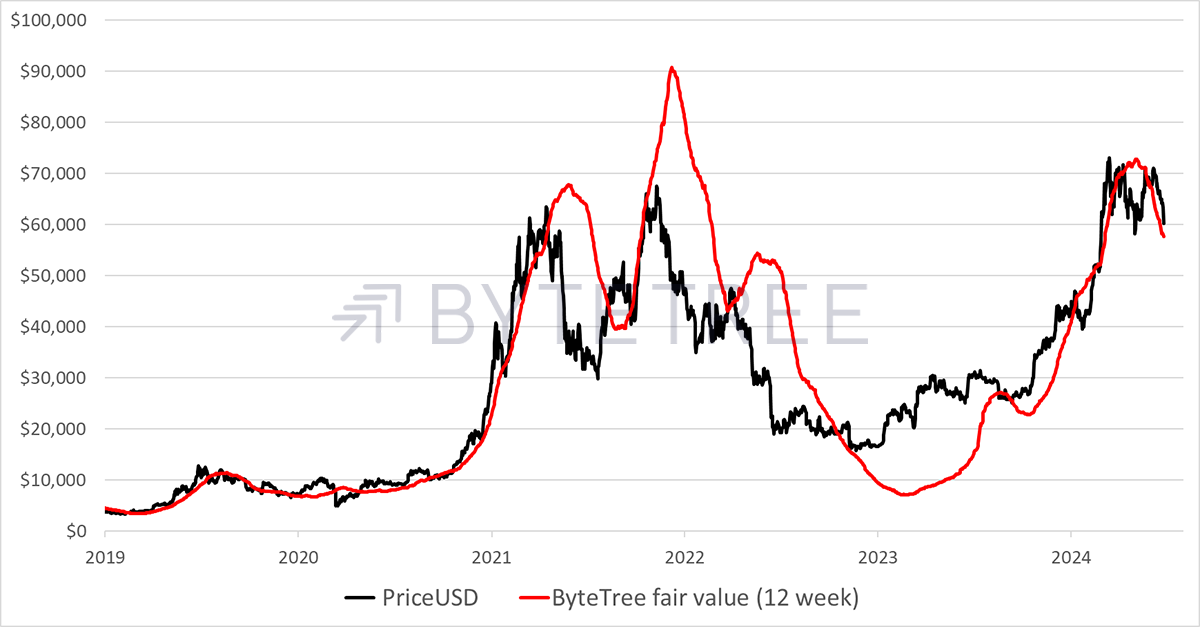
More importantly, the “spend”, which is the number of dollars bouncing around the blockchain, is falling again. The implied fair value is around $59,000. It should settle soon.
ByteTree Bitcoin Network Fair Value
It is tempting to downgrade Bitcoin to neutral, but there isn’t much point as a bear market seems most unlikely. This is the seasonally weak period after halving that was overhyped by the US ETF launches. Past halving cycles have seen a run-up to halving, then a pause, followed by a new all-time high. Maybe Bitcoin wasn’t ready for $70k and should have settled for $40k, which would be in line with the last two halvings.
Bitcoin Price and Halvings
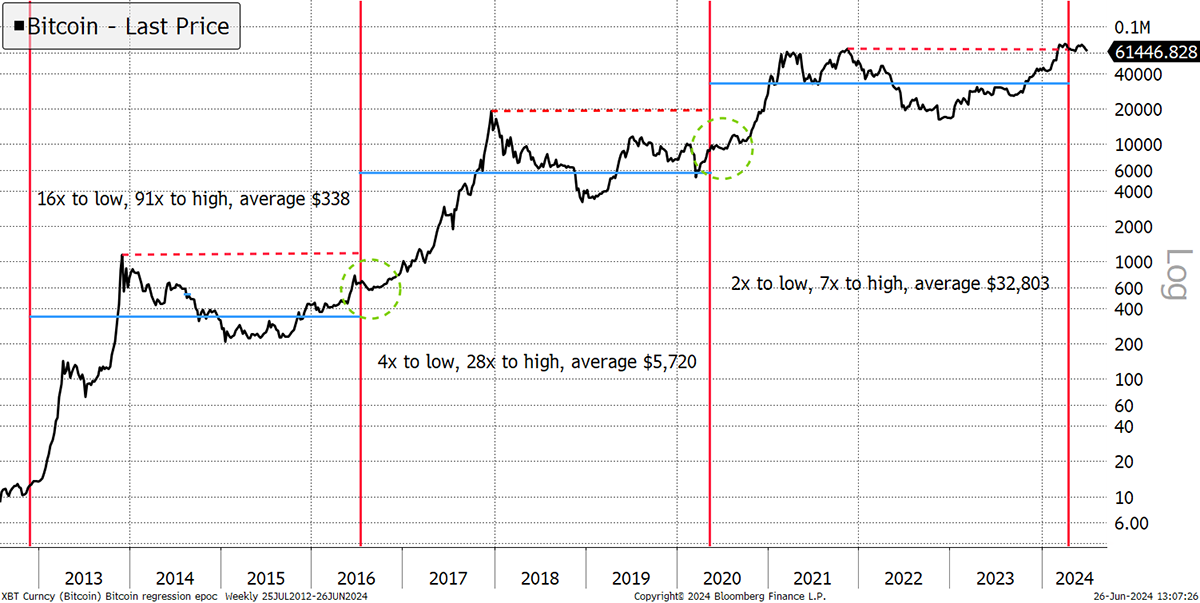
Notice how in 2016 and 2020 halvings, the price stalled for six months until it shot up a few months later in October (Uptober in Bitcoin speak). More importantly, Bitcoin went into halving below the previous high, with a rally as it approached. This time, it had just made an all-time high as it got caught up in the US ETF launches. Might this have skewed the cycle?
I think so.
The price at halving would have been in sync with past cycles at $40k rather than $70k. But, on the other hand, I am delighted we have US ETFs. I suspect we just have to wait for the summer to pass and for the hype to cool. Bring on Uptober.
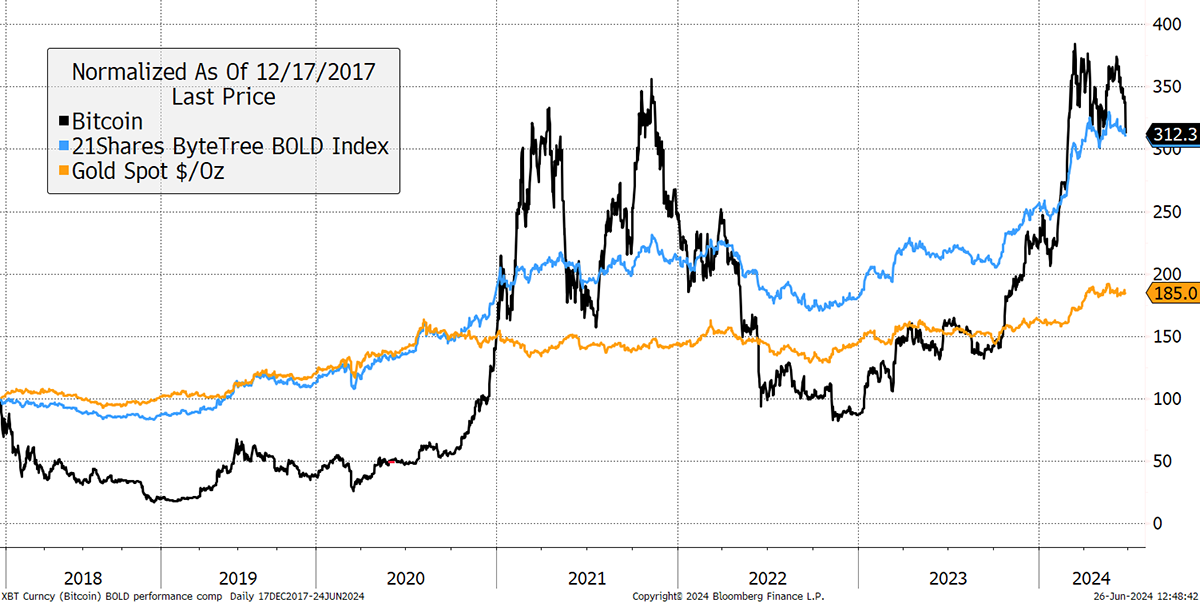
BOLD (LY) Kicking Ass
Finally, I’ll end on BOLD with my favourite chart, which shows BOLD catching up with Bitcoin once again since the 2017 Bitcoin high. In those 6 ½ years, BOLD has been ahead of gold 42% of the time and Bitcoin, 79%. Not only that, but Bitcoin had a volatility of 66.9%, BOLD 17.2% and Gold 14.0%. Not bad at all.
BOLD Passes $10 million AUM
If you would like to learn more about BOLD, then please have a browse on the BOLD.Report website. We haven’t finished building it quite yet, but it has come along leaps and bounds.
Summary
There will be no downgrade to neutral for the simple reason that it all makes sense, and any weaknesses are explainable and justifiable after a seismic 18-month rally. The bull market remains intact, but a soft patch has begun.
Charlie Morris is the Editor and Creator of ATOMIC. Fascinated by the emergence of a new asset class, but unsure how to make sense of it, he started to analyse the Bitcoin blockchain in 2013.
Charlie has 26 years of fund management experience and is a pioneer of multi-asset investing. At HSBC Global Asset Management, he launched the Absolute Return Service in 2002, which grew to over $3 billion. Much of that success came from moving away from the crowd and embracing a wider range of asset classes that traditional investors were not familiar with at the time.
We very much welcome your comments and feedback. Help us improve our service by contacting us at atomic@bytetree.com.