ByteTree Market Health Update; Issue 78
The price of Bitcoin has recovered back to the $40,000 zone, having touched $30,000 last Wednesday. That was a day from hell, and the bounce will go down in the record books. I will update you on the key things to watch out for in Bitcoin under the Network Demand model section.
I want to revisit the gold market, which broke back above $1,900 this morning. That was the high from 2011, so it’s an important level. There is still so much confusion between Bitcoin and gold. My view is clear. They coexist, and they both thrive in an inflationary environment.
Since the Bitcoin halving in May, it is remarkable that fund flows into Bitcoin have outrun flows into gold. Pre-September last year, gold had seen $26bn of inflows since May and $49bn since January. These are huge amounts.
At the time, investors were deeply worried that the world economy was headed for a prolonged slump. Gold surged, as it does under such circumstances.
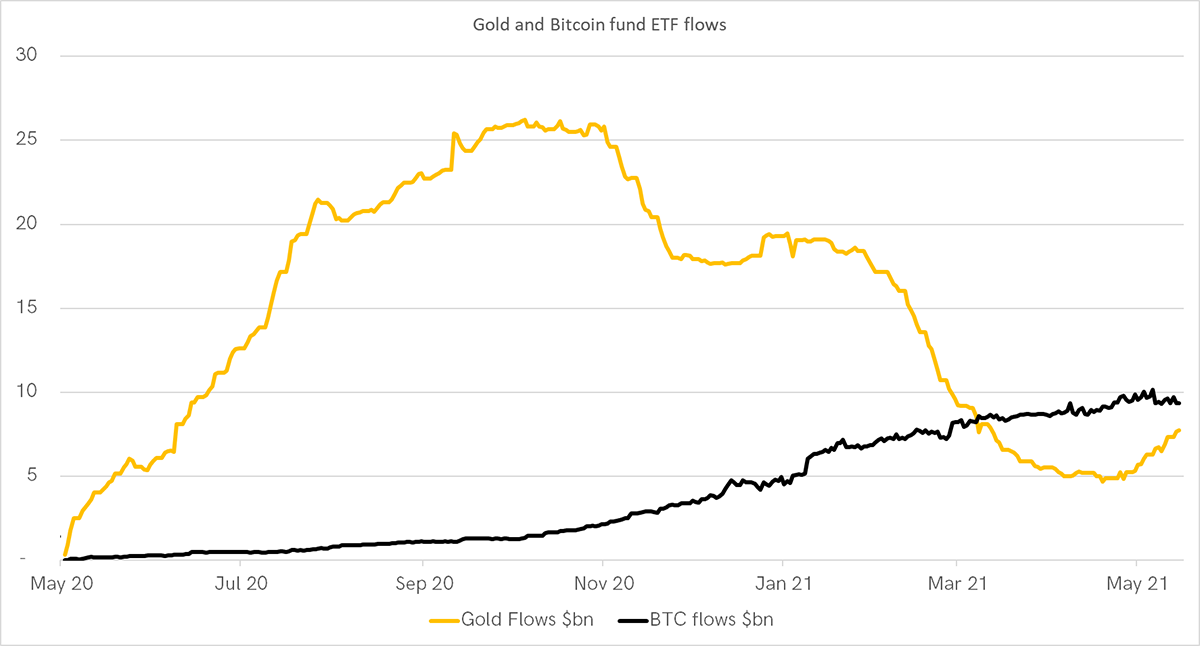
As the recovery got underway, the gold price cooled, and investors fled. By early May, $16bn had left the gold ETFs, which reduced the total amount of gold held by 10%. That was nothing compared to the 2013 to 2015 era, which saw the gold ETFs contract by a staggering 44%.
It is a stark reminder of the behaviour of hot money. As soon as the trend comes under pressure, the money flees. Where did the gold money go? Bitcoin, or at least some of it.
While gold was suffering, inflows into the Bitcoin ETFs accelerated. A year ago, the Bitcoin market was tiny compared to the gold market. By the time of the Bitcoin breakout in October, when the price was $12,000, flows had reached $1.5bn. To put this into perspective, it was broadly equivalent to $83bn being shovelled into the gold market. It was big.
These flows were so vast that they tightened the market by scooping up all of the miners’ inventory and more. An all-time high followed in December, above $20,000, and Bitcoin became the talk of the town, not for the first time.
My simple thesis has been that gold and Bitcoin are both inflation-sensitive “hard assets”. Aside from the physical differences, gold has always preferred a world of fear when markets have been under pressure. In contrast, Bitcoin has thrived during the good times, alongside risk assets in general.
The shift in the investment environment is normally reflected by the change in the bond yield. In early August, the US 10-year treasury yield made its low, just as gold made its high. NO coincidence there. Then in March this year, the bond yield made its high shortly before Bitcoin peaked.
This relationship between the bond yield and the preference for gold or Bitcoin doesn’t just show up in price, but in the fund flows too, albeit with a time lag. Here I have shown the difference between the recent Bitcoin and gold fund flows. When the line was falling, money was flowing from gold to Bitcoin and vice versa.
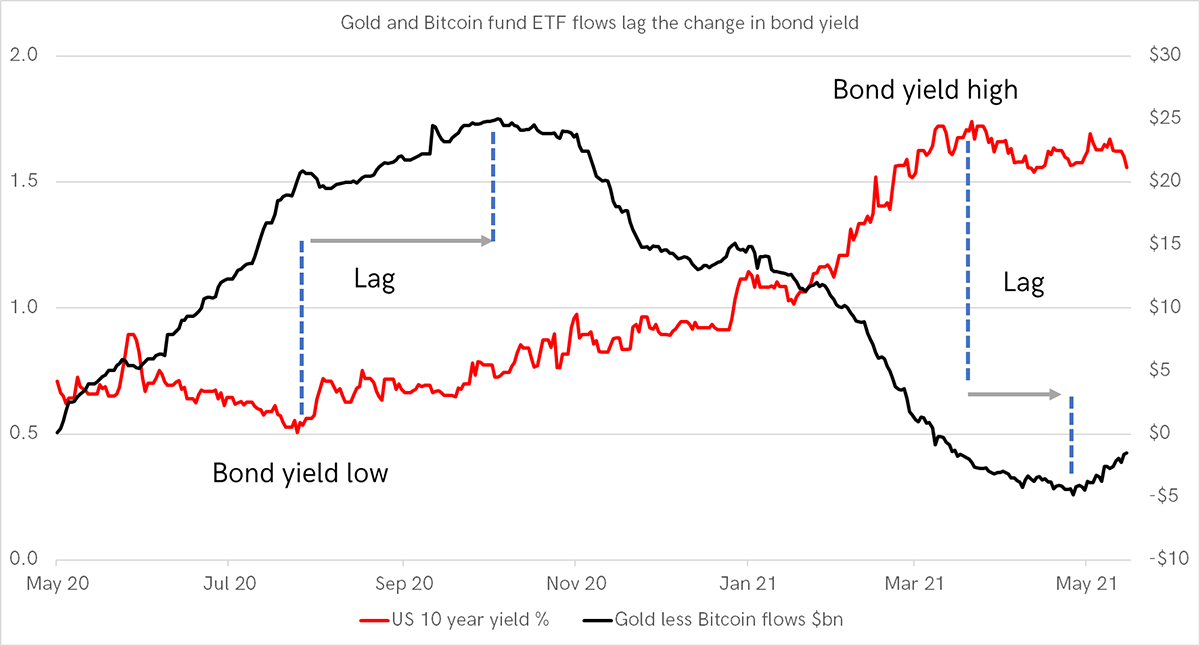
Over the past month, the flows have swung back in favour of gold. Already we have seen just under $1bn leave the Bitcoin ETFs, while $3bn has returned to gold. The macro environment currently favours gold, although it goes without saying, it’s more like driving a steam roller than a Lambo.
Price to flow
Although somewhat unscientific, the link between price and flow is shown below. The Bitcoin price was lagging the fund inflows until September. It then stabilised, which led to the Q4 price surge. Recently, Bitcoin has started to lag the fund flows, which have been negative.
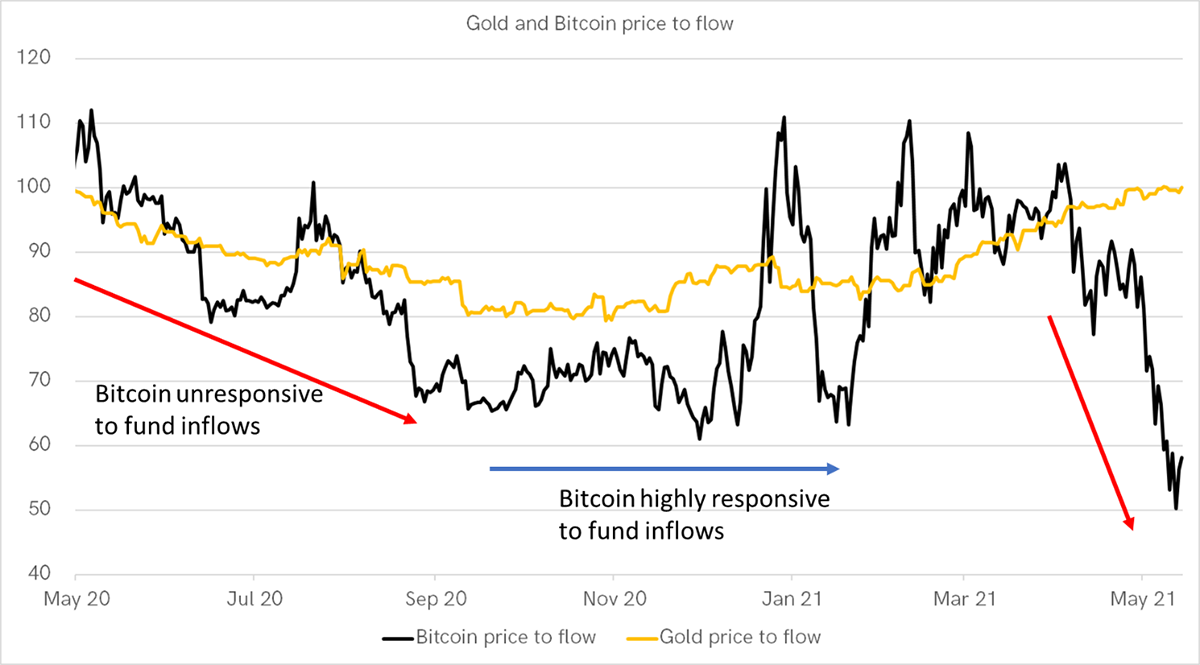
Contrast that to gold, where the price is ahead of the flows. As I said, there’s no Lambo here, but gold seems to be in the sweet spot.
This is telling you that every dollar invested into gold, at this point in time, has an unusually positive impact on the gold price. That is exactly where Bitcoin was last October. In contrast, Bitcoin is no longer tight. The data is volatile, but the implication is that selling by Bitcoin funds has an unusually large downward impact on the price. Keep an eye on the fund flows. I’ve always felt they would be important this cycle.
Bitcoin update
I’m quite proud of this chart. Everyone wants to know why?
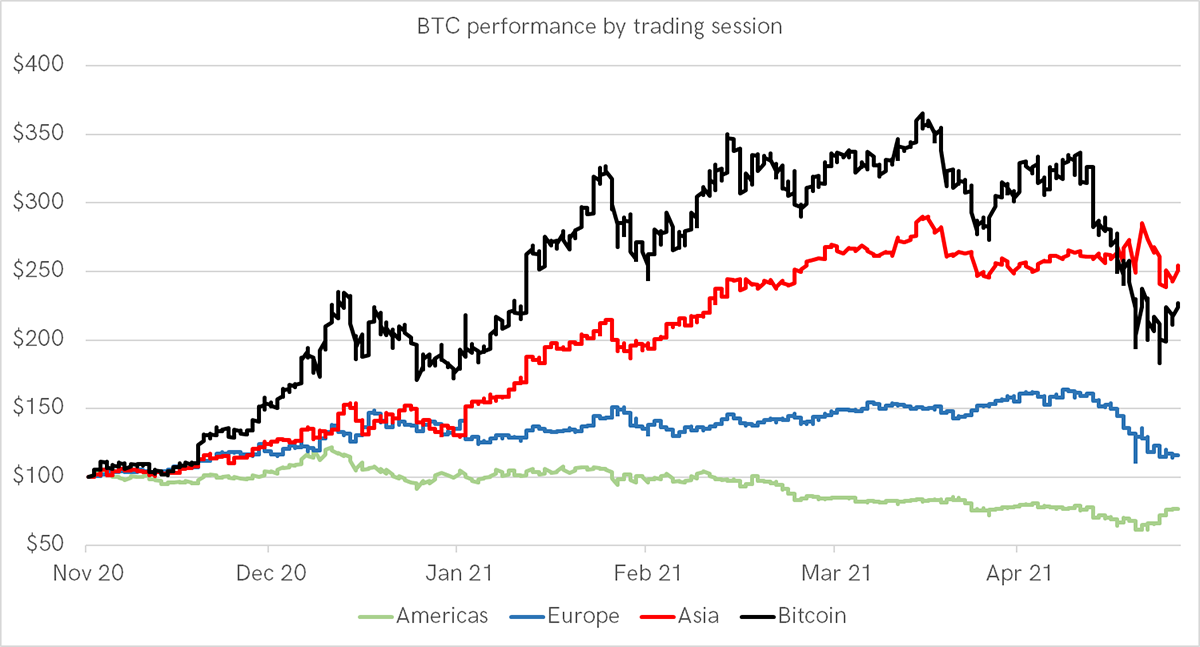
I can’t be certain but imagine most derivative activity occurs during American trading hours, with the least during Asian hours. Derivatives, contrary to popular belief, normally dampen volatility. I believe this might be similar to the S&P 500, heavily laden with derivatives, which performs best while America is asleep.
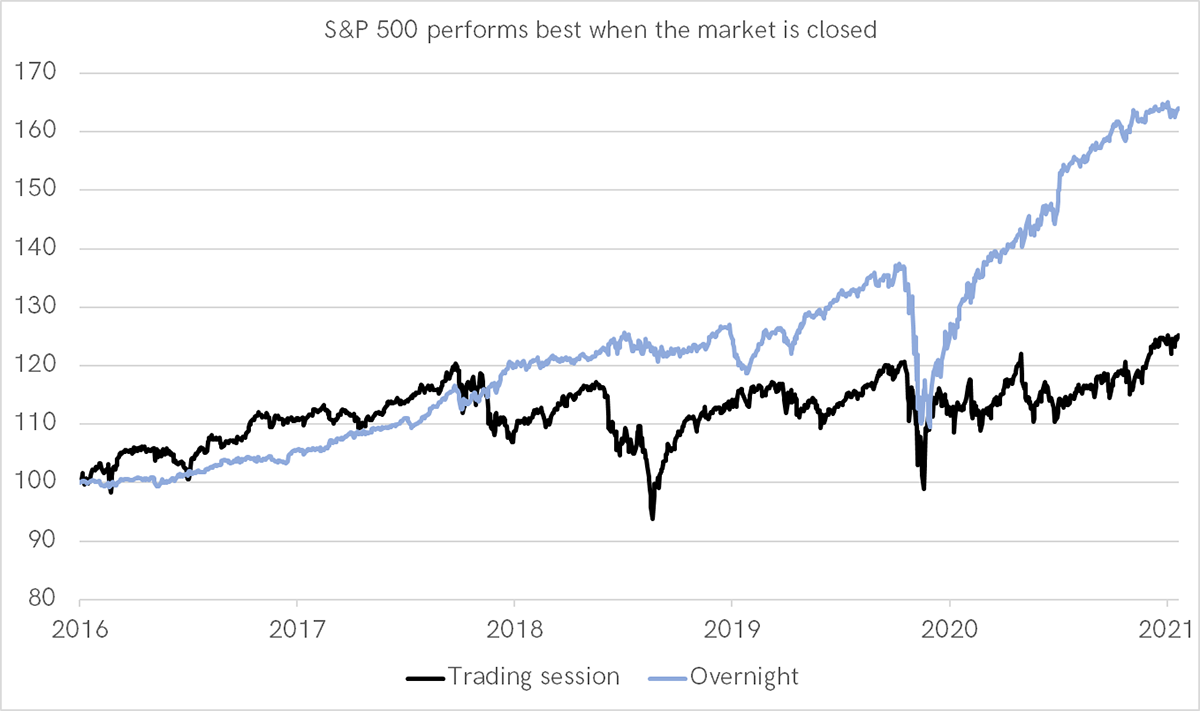
I kid you not. The S&P 500 does best when it is closed. How can it move when it is closed?
This chart compares the market opening price to the closing price. The next day, the market normally opens higher than it closed the day before. That explains the impressive performance while the market is asleep. Openings are overly bullish, while closes are overly bearish.
The same seems to be true for Bitcoin during American hours. The lesson here is don’t buy Bitcoin when the Americas get up and go to work. Buy when they go to bed.
On-chain
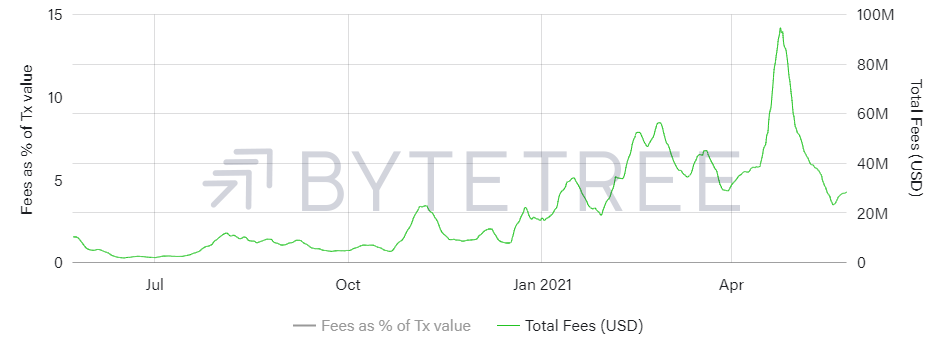
Last week, I mentioned the importance of fees. The good news is they have turned upwards. This means the blockchain is not dead.
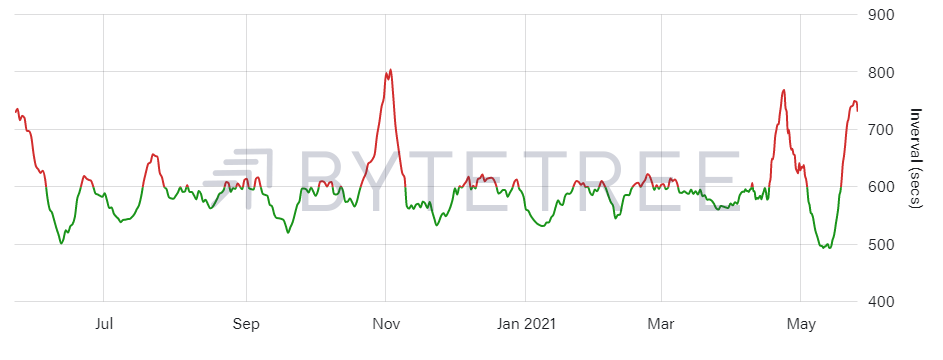
The other issue I highlighted was the average block time. It should be 600 seconds (10 minutes) but has risen as China has banned mining, according to stories on the internet. The average block time is not falling, which has coincided with the price recovery.
Block times start to speed up
Finally, the only chart I would like to see pick up is the number of transactions. It is not a game changer, but reflects the big money squeezing out the little guy.
Transactions remain weak
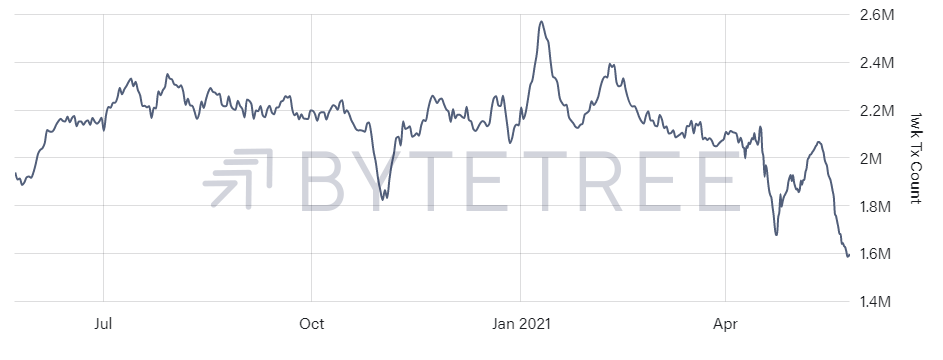
It was the little guy that built this space, and that is what troubles me. We know exactly how the big money behaves from our flow analysis above. It flees at the first signs of trouble. Never dismiss the little guy.


