Kicking the Gold Valuation Models
Disclaimer: Your capital is at risk. This is not investment advice.
Atlas Pulse Gold Report; Issue 65
The bad news is the latest calibration brings down the constant from 4 to 3.54. That takes fair value from $2,061 to $1,824. The good news is that gold remains slightly undervalued, and the cheapest it has been since 2007.
Highlights
| Regime | US equities surge but margin debt is now falling |
| Macro | What did the Bank of England just do? |
| Valuation | 12% cheap becomes 2% cheap on recalibration |
| Flows and sentiment | Modest outflows continue |
| Technical | Rangebound |
Regime
Strength in equities is rarely a good backdrop for gold. Here’s a quick reminder that gold’s best years have tended to coincide with rough patches for equities, and vice versa; not exactly negative correlation, but clearly following a different path.
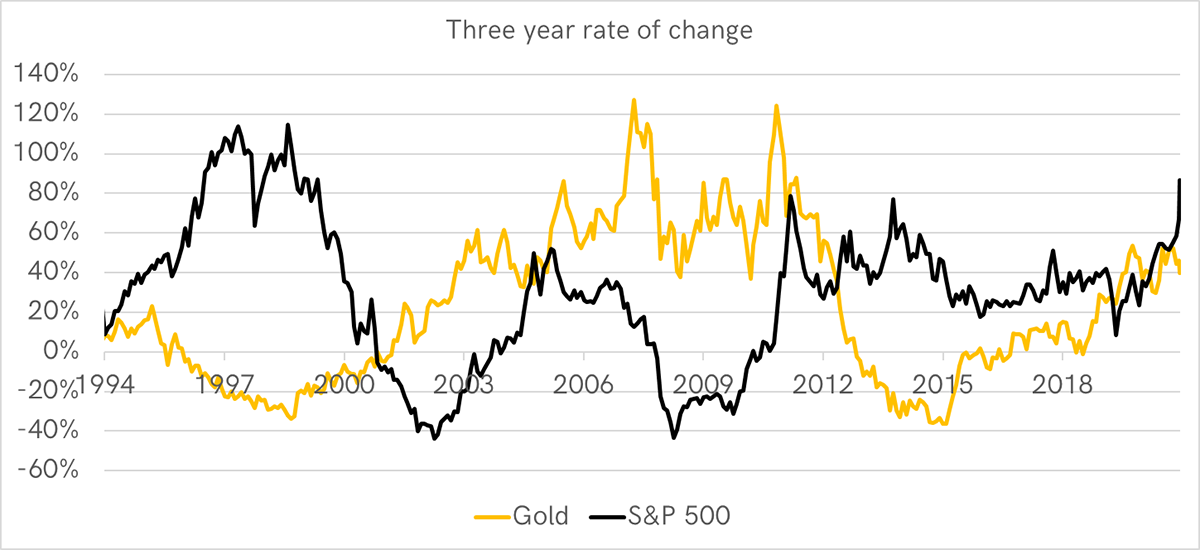
Source: Bloomberg. S&P 500 and gold 3-year rate of change since 1994.
That said, all good things come to an end, and US equities have had one hell of a run. We’ve known about high valuations for years, but that alone won’t be the straw that breaks the camel’s back. A surge in rates and/or inflation, or an economic crunch seems more likely to stall further progress.
One thing stands out. Margin debt seems to have peaked in August, with the growth rate now slowing. Stockmarket bubbles are fuelled by leverage. This data looks across Wall Street and measures the debt in the system. Major peaks haven’t ended well.
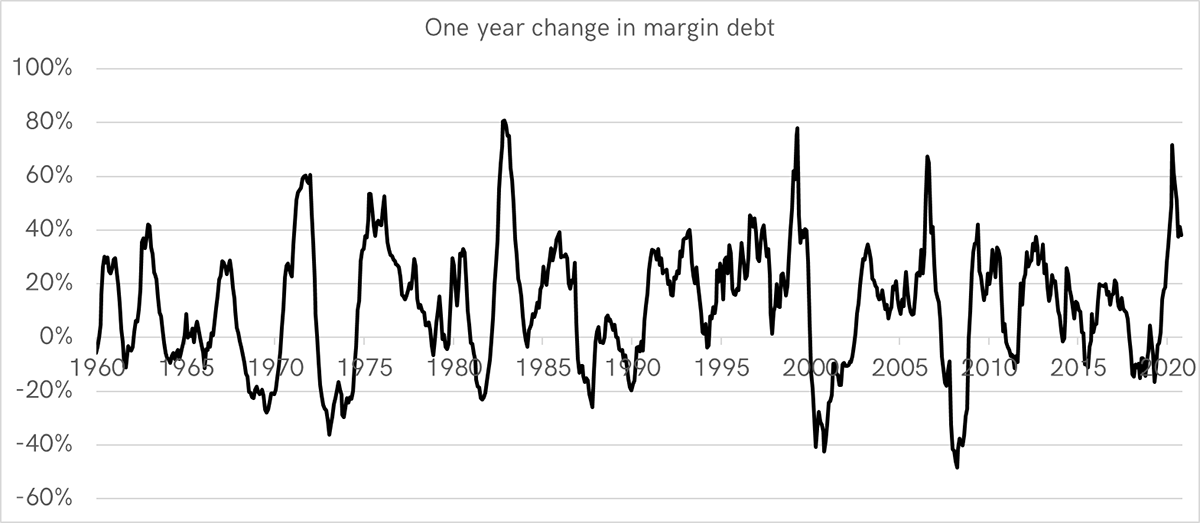
Source: FINRA. Year on year change in US Debit Balances in Customers' Securities Margin Accounts since 1960.
Prior notable peaks include:
- June 2007
- March 2000
- November 1983
- November 1972
November 1983 was a forgettable peak, even though the market stalled for a year. But all the others went down in history. The collapse of 1973/4 was one of the worst bear markets on record, largely attributed to a surge in rates (5% in 1972 and 12% by 1974) in order to combat inflation. The year 2000 saw tech blow up, and in 2008, the banks.
Could margin debt be telling us something?
Macro
The key macro points are a strong US dollar, which is easy to understand when you see who they are up against. The Bank of England was widely expected to hike rates yesterday as RPI touched 4.8% YoY. They didn’t, which makes a mockery of their independence.
Who is the governor these days? Answer; Boris Johnson, and boy does he like spending.
Atlas Pulse readers know that it is the longer-term inflation expectations that are the most important. So far, this transitory inflation surge has failed to reignite the long end of the TIPS curve. The 30-year inflation expectations (green) have barely moved, while the 1-year (red) appear to be cooling.
Transitory inflation has not been disproven by the market (not yet anyway)
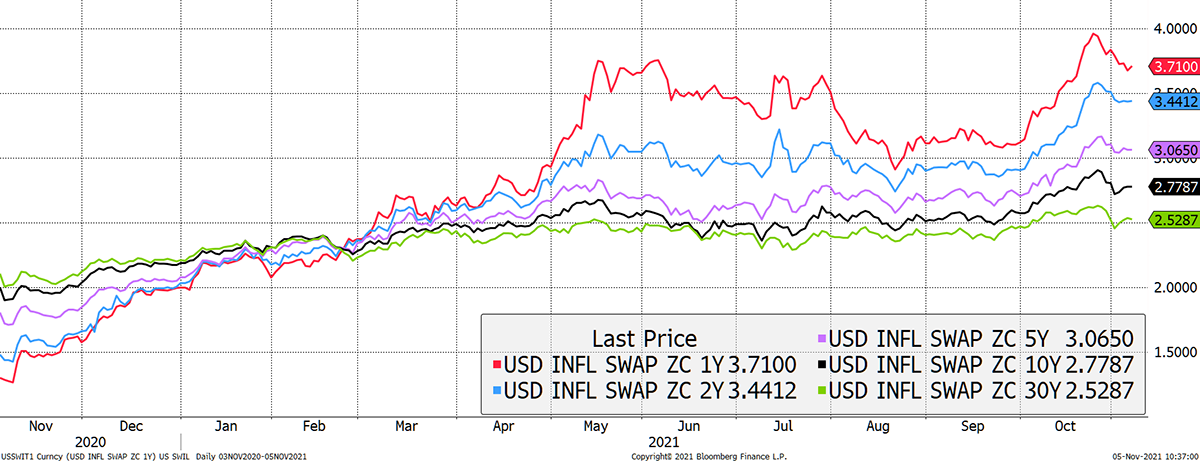
Source: Bloomberg. US inflation swaps over the past year.
This is why the gold price remains sluggish. It has little to do with investors buying bitcoin instead of gold, even though some probably are.
Valuation
I have some good news and some bad news to report, as is it is time to recalibrate the gold valuation models. I haven’t done this for a while, but things have moved on, and I am keen to make this as robust and transparent as possible. This adjustment will make the models ever more accurate over time. Now we have 23 years of data in the bank, there’s no time like the present.
To recap, this model is based on the idea that gold is a bond. In asking what kind of bond it is, I came up with five answers:
- It is a zero-coupon because it pays no interest.
- It has a long duration because it lasts forever.
- It is inflation-linked, as historic purchasing power has demonstrated.
- It has zero credit risk, assuming it is held in physical form.
- It was issued by God.
That means gold is simply a zero-coupon, long-duration inflation-linked bond. It compensates you against past debasement and is impacted by the expectation of how rates and inflation will change in the future. It works.
Here is gold against the Bloomberg US 10+ TIPS Index. That index has an advantage as it pays a yield, which over 20 years, starts to add up.
Gold and TIPS
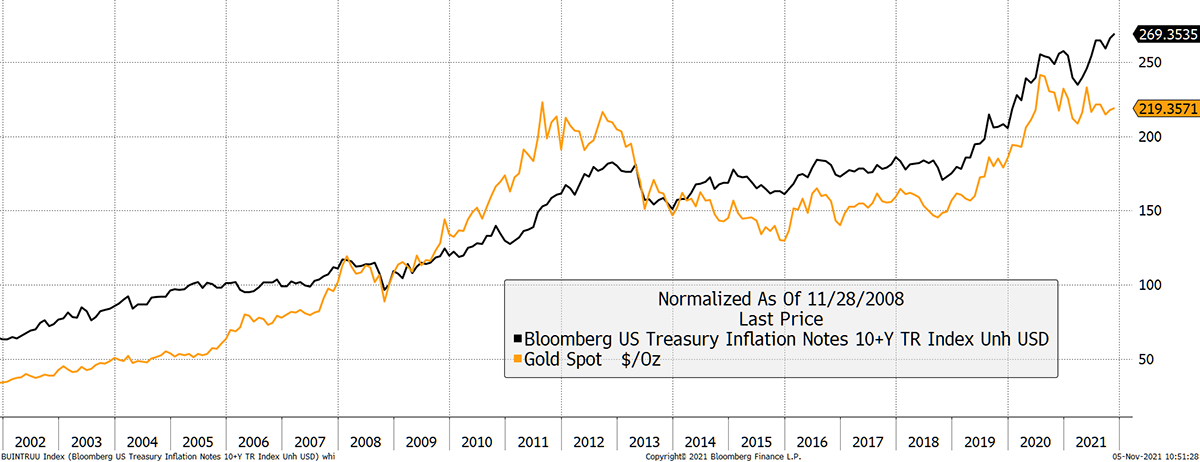
Source: Bloomberg. As described since 2002.
However, this TIPS index has seen an average volatility of 11%, in contrast to gold’s 16% over the period. That means the 10+ TIPS selected don’t have enough duration to match gold. Indeed, on examining the index, duration is 15.75 years, and by my calculations, gold should be closer to 20 years. This would disadvantage the TIPS index as it would have enjoyed lower capital gains as interest rates drifted towards zero.
The theory of modelling gold as a 20-year zero-coupon TIPS is sound, but the calibration has always been the source of doubt. All we can do is a best fit, using all of the available information since 1998 when TIPS data was first published. We had no way of estimating future inflation expectations prior to that, which is the key to analysing gold.
This model was created in 2013, with comparatively little information to work from. It is obvious that gold was undervalued between 1998 and 2005, as it endured a 20-year bear market. Intuitively, gold was overvalued between 2010 and 2012, with a period of fair value until the 2020 boom.
In calibrating this model, I have decided to move from a best fit using a regression, to an average premium/discount between the gold price and the model summing to zero. As each year passes, we learn more about gold’s actual behaviour against its theoretical behaviour and update this calibration as each boom and bust builds our knowledge. As the 1998 to 2005 era was cheap, this pulls down the valuation, but future adjustments are likely to rise as the years pass.
The bad news is the latest calibration brings down the constant from 4 to 3.54. That takes fair value from $2,061 to $1,824. The good news is that gold remains slightly undervalued, and the cheapest it has been since 2007.
Gold valuation methodologies
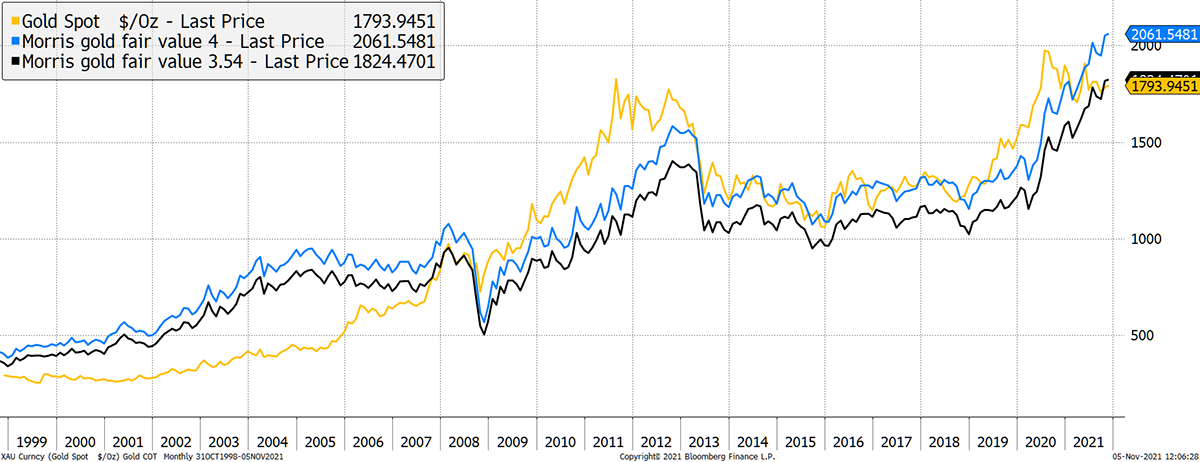
Source: Bloomberg; ByteTree Asset Management. Gold fair value models with calibrations of 4 and 3.54 since 1999.
This recalibration is harsh, and I accept that. It is hard to believe that gold wasn’t undervalued in 2015, yet the overvaluation in 2011 and 2020 make sense.
As I have said many times before, the calibration has always been the weakest link in this process. It requires an educated guess. But at least this approach is completely objective, and I believe it is right to base the calibration on fact (historical average from real data), as opposed to a best fit. Each year, this will become ever more accurate.
The key point is the new calibration takes the 23 years of available data and brings the average premium close to zero (-0.13% will do). The irony is that gold has been fair value in 2008 and last month; it doesn’t seem to visit often.
Gold undervalued
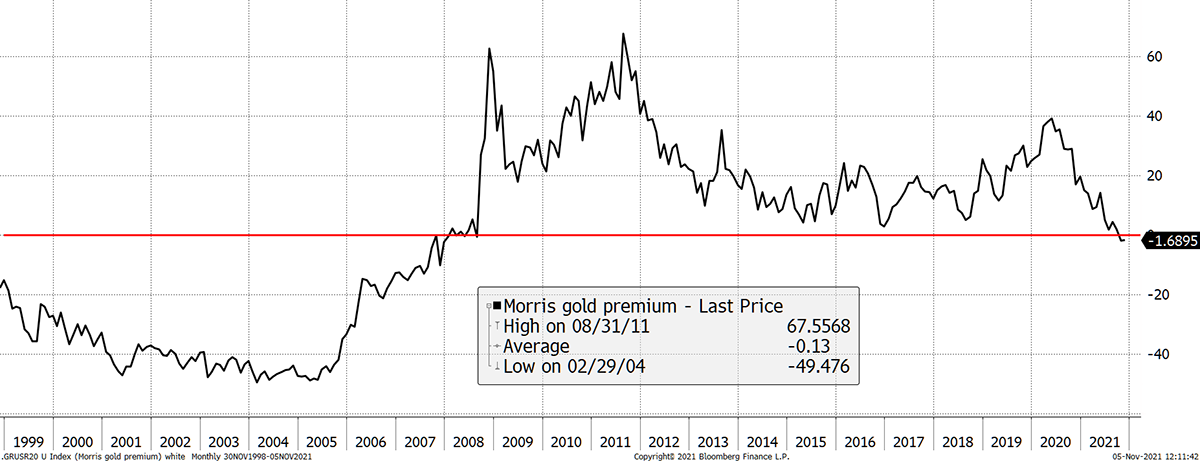
Source: Bloomberg; ByteTree Asset Management. Gold premium/discount to gold fair value model (calibrations of 3.7) since 1999.
ByteTree’s gold models will be adjusted.
The bottom line is the world is heading for a period of monetary madness, and knowing this model is conservative in its approach should boost confidence rather than detract from it.
In the next issue, I will discuss variations to the inputs. That’ll be our Christmas Special!
Flows and sentiment
The narrative is that gold buyers have turned to Bitcoin. It may be true at the margin, but the stall in real rates since last summer explain events.
Until then, gold enjoyed record investor inflows peaking at $66bn in October 2020, with $23bn flowing back since then. Although silver flows have remained fairly stable, you would normally expect them to surge in an environment like this. Money printing and an inflation surge have got the silver bugs roaring, in past years at least.
The same old arguments crop up about debasement as everyone scrambles to understand macroeconomics. Yet this time, they didn’t buy silver. They bought Bitcoin. Bitcoin has overtaken silver in terms of fund flows.
Gold, silver and Bitcoin Fund and ETF flows
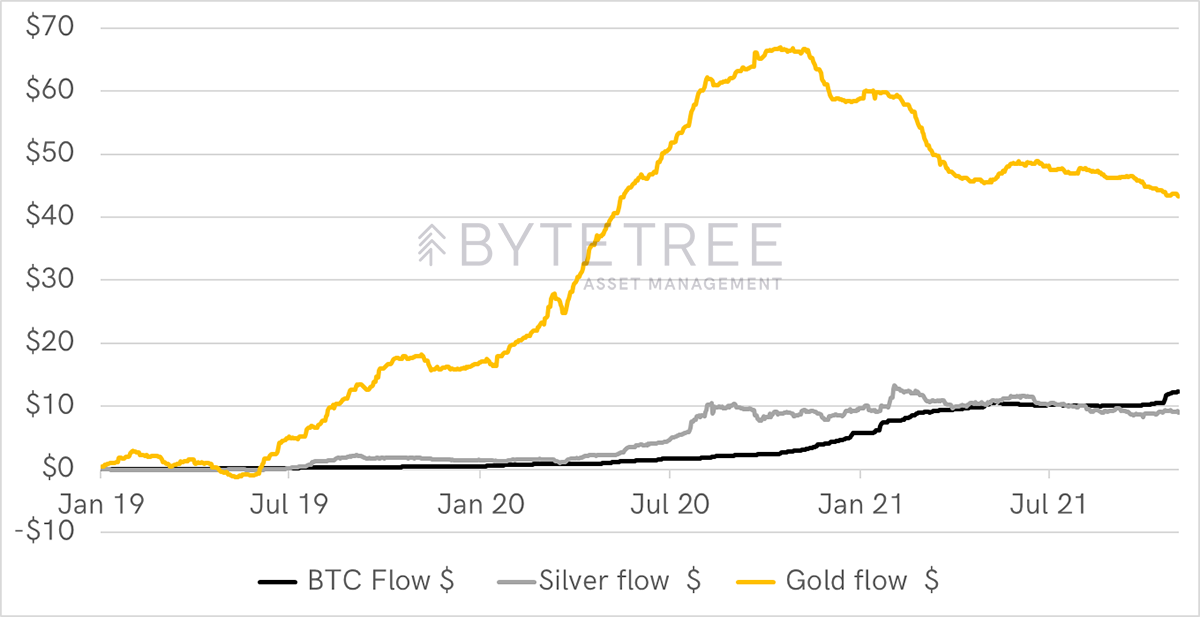
Source: Bloomberg; ByteTree Asset Management. As described since 2019.
Looking at total assets under management, Bitcoin overtook silver earlier this year. There were $10bn of inflows into these funds, but they made 5x from price appreciation and are now worth $50bn.
Bitcoin funds overtake silver
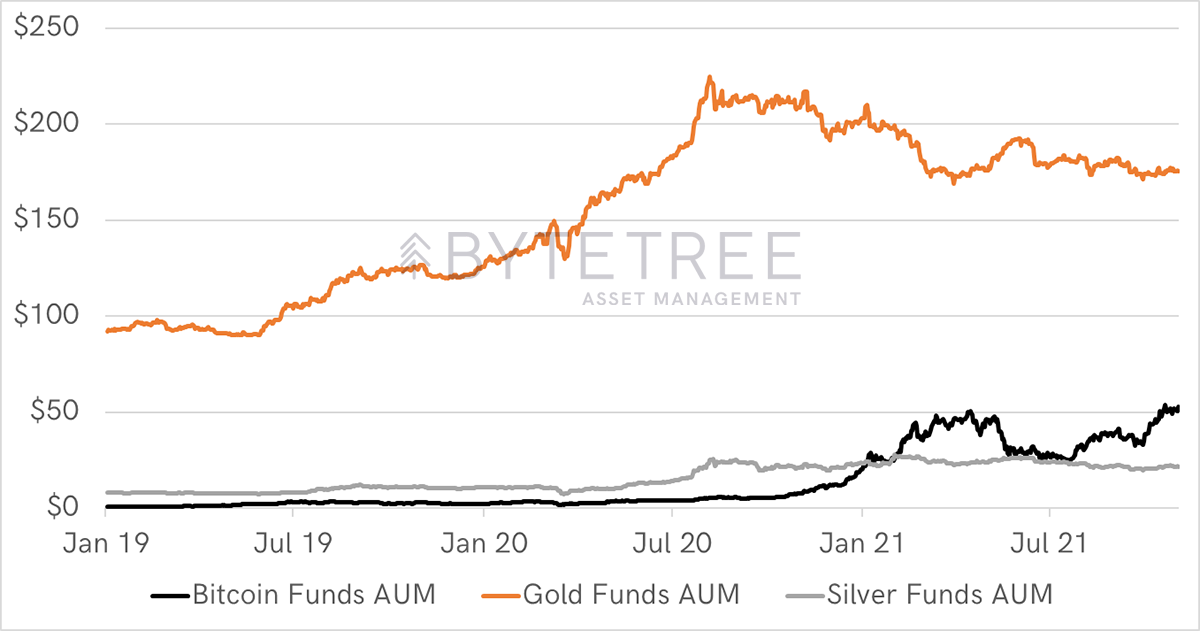
Source: Bloomberg; ByteTree Asset Management. Assets under management as described since 2019.
Bitcoin really is catching up with gold in terms of ETF assets. Bitcoin ETFs hold 30% of the value of gold ETFs, which is remarkable, especially when you think how a typical wealth manager hasn’t even bought it yet.
Bitcoin fund as a percentage of gold funds
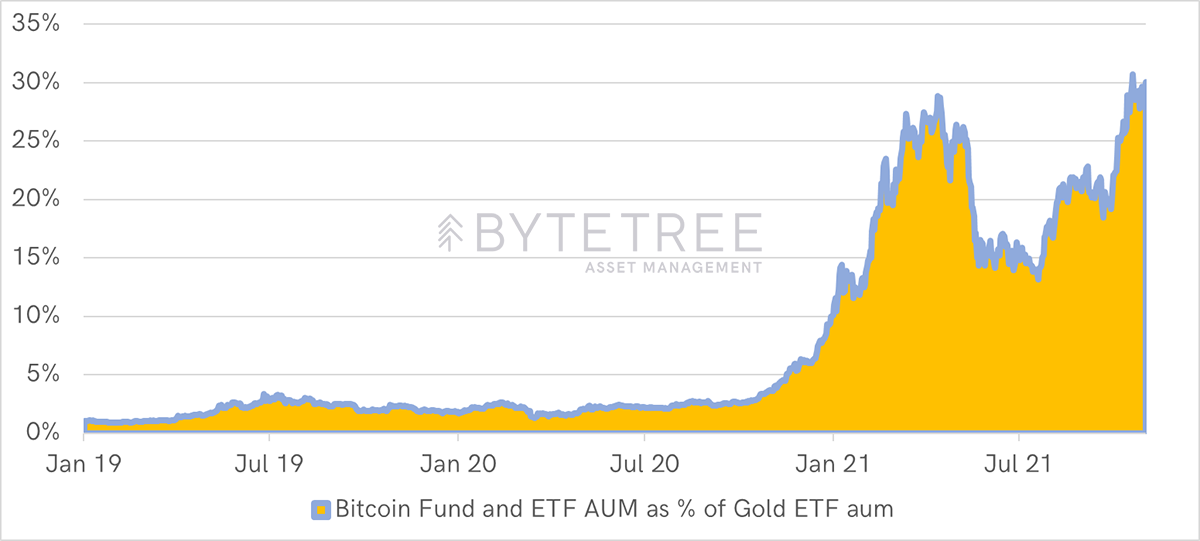
Source: Bloomberg; ByteTree Asset Management. Bitcoin AUM as % of gold AUM since 2019.
But here’s the killer. Bitcoin funds are 2.5 times larger than silver ETFs. Does this mean silver is dead? On the contrary, it just means it’s unloved and, most probably, undervalued. But Bitcoin is the new silver.
Bitcoin fund as a percentage of silver funds
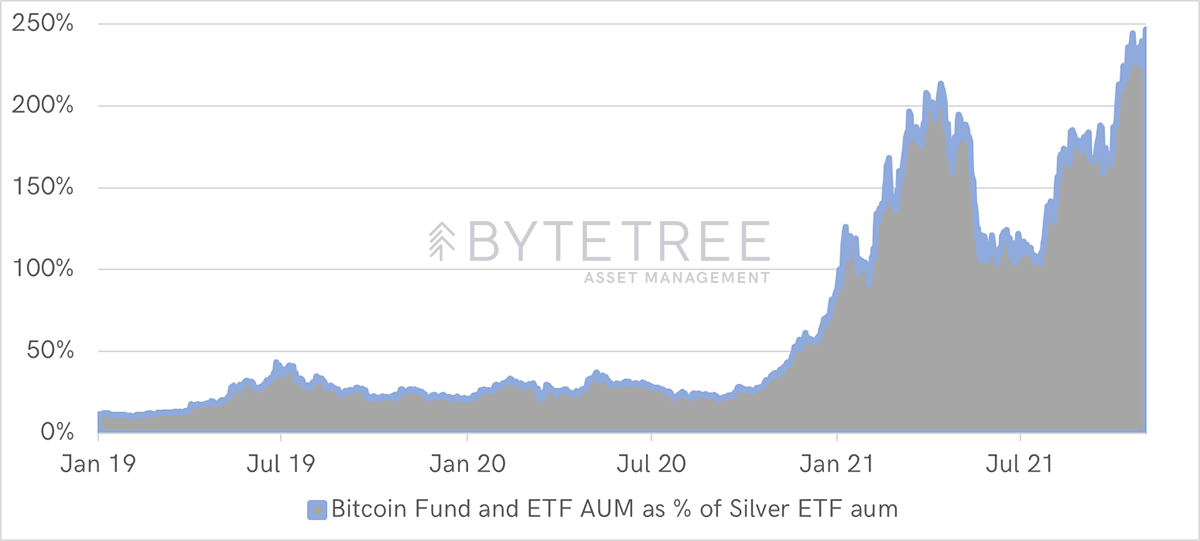
Source: Bloomberg; ByteTree Asset Management. Bitcoin AUM as % of gold AUM since 2019.
Summary
The environment for gold remains constructive because you can see where things are going. I’ll quote Russell Napier, the guru of gurus:
“I’m very bullish on gold. The problem for gold in the last year was that interest rates have gone up, because people still believe there will be a link between inflation and interest rates. If people believe there will be inflation at 4%, they will say interest rates will ultimately be at 5 or 6%, hence they don’t want to own gold. It’s only when they begin to realize that that link is broken, that the gold price will lift off.”
He’s the man.
I remain bullish. Thank you for reading Atlas Pulse.