ByteTrend: Part 1
ByteTrend is a trend following strategy for crypto developed by ByteTree to identify the leading crypto trends. It is a simple yet powerful tool that enables investors to stay on top of the market.
Trend-following
The aim of trend following is not to identify market tops and bottoms but to identify trends. The basis is that trends continue for a period, and prices have their most profitable moves during these conditions.
By entering the trade as the new trend begins and exiting when it comes to an end, investors stand to profit in this tried and tested strategy. Should the price move be substantial, the trade will generate significant profits. However, if the trend is short-lived, then the position may result in losses. The best course is to cut early and await the next opportunity.
The greatest price moves in history have all seen significant profits made by trend followers, of which there are many different techniques. Given this is a multi-billion-dollar industry, it is safe to say that trend following works as proven in financial markets.
How ByteTrend Works
This is a technical indicator that combines moving averages and a maximum/minimum price range indicator. These are widely used by investment professionals.
In addition, ByteTrend calculates a score ranging from 0 to 5. Strong bull trends rank 5/5 in contrast to strong bear trends, which rank 0/5. Scores between 1/5 and 4/5 are in the neutral zone.
A ByteTrend score gets a point for each of the following criteria:
- Price is above the 280-day moving average
- Price is above the 42-day moving average
- The 280-day moving average slope is rising
- The 42-day moving average slope is rising
- The last touch of the 20-day max/min lines was max
View ByteTrend on ByteTree Terminal
Example: Litecoin (LTC)
Let’s use LTC to demonstrate how to calculate a ByteTrend score.
42-day moving average
LTC is $150, while the average price over the past 42 days (42-day moving average) is approximately $200. LTC has the potential to score 2 points if the price is above the moving average and it is upward-sloping. Since the price is below the moving average and it is downward sloping, no points are scored.
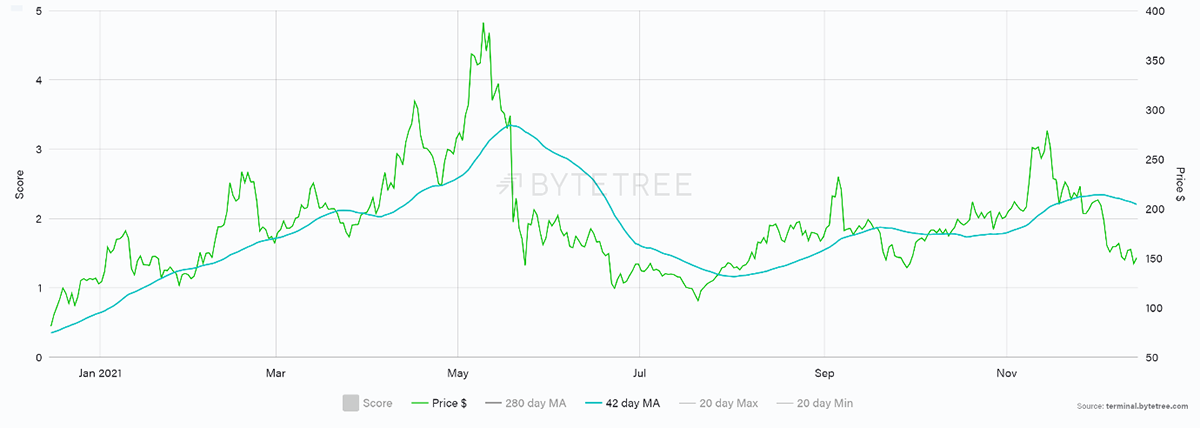
Source: ByteTree. LTC price ($) and 42-day moving average.
280-day moving average
LTC is $150, while the average price over the past 280 days (280-day moving average) also happens to be approximately $200. LTC has the potential to score two points if the price is above the moving average and it is upward sloping. Since the price is below the moving average and it is downward sloping, no points are scored.
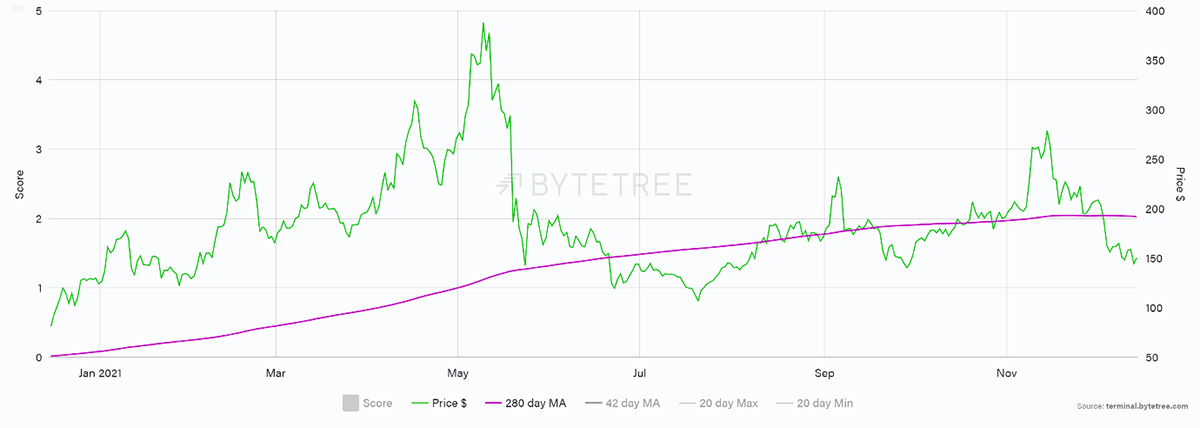
Source: ByteTree. LTC price ($) and 280-day moving average.
In this case, the moving average appears to be flat, but when you zoom in, it is downward sloping (below). Fear not what your eye sees as the computer makes these calculations.
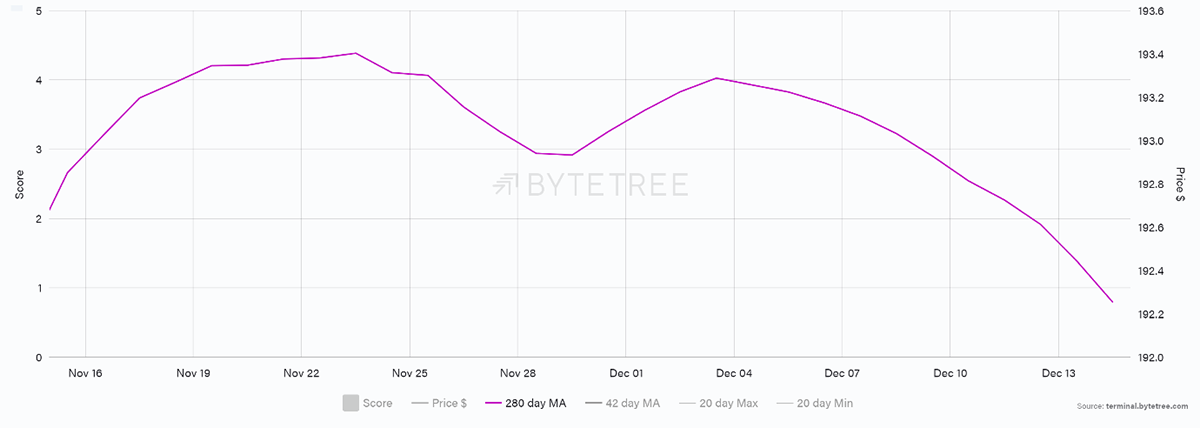
Source: ByteTree. LTC 280-day moving average.
20-day Maximum & Minimum
The 20-day max and min lines record the highest and lowest price over the past 20 days. The max line is always higher than the min line (although they would be the same if the price did not change over the past 20 days which is impossible in liquid, traded assets).
A ByteTrend point is awarded for the last touch being max.
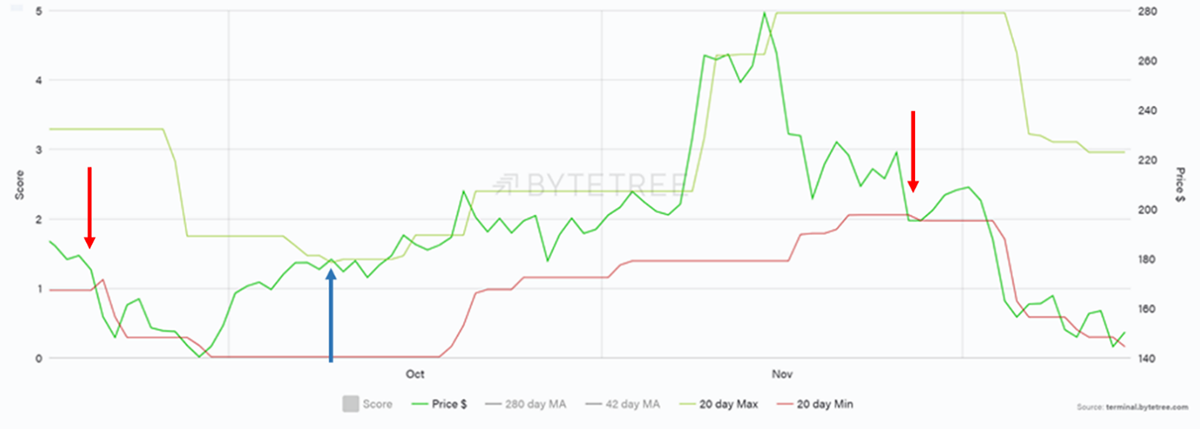
Source: ByteTree. LTC price ($) and 20-day max/min.
The left red arrow shows a touch of the min line in late September, so the score is at zero. The price then rallied to $180 (blue arrow) and touched the max line, and the score is now one.
The rally continued into mid-November before turning down and touching the min line in late November (red arrow). At this point, the score returned to zero, where it remains.
Putting these together:
LTC ByteTrend score
| 1. Price is above the 280-day moving average | 0 |
| 2. Price is above the 42-day moving average | 0 |
| 3. 280-day moving average slope is rising | 0 |
| 4. 42-day moving average slope is rising | 0 |
| 5. The last touch of the 20-day max/min lines was max | 0 |
LTC scores 0/5, which is bearish. That doesn’t mean the price will fall with certainty, but a prudent investor would wait for a higher score so they could buy into strength. LTC has seen better times, and ByteTrend records the historic score.
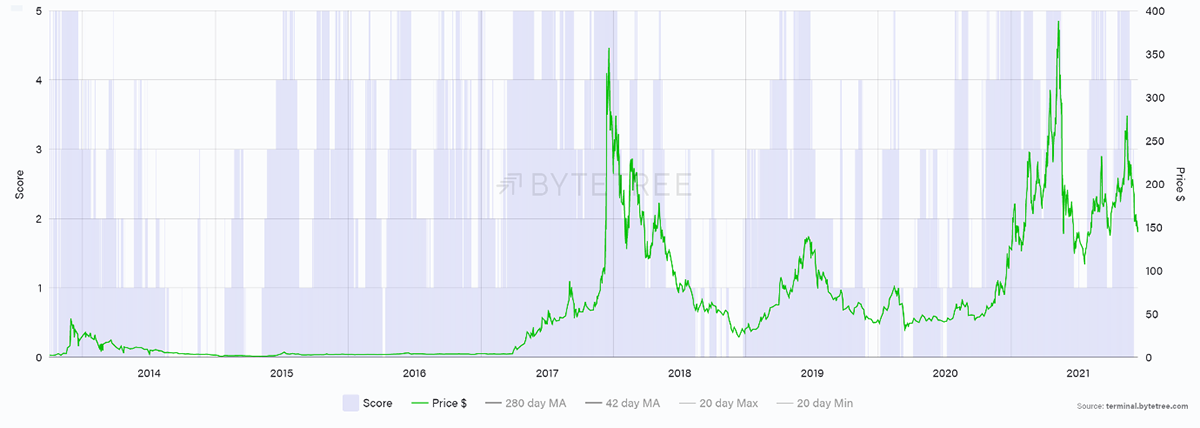
Source: ByteTree. LTC historic ByteTrend score (blue) and price ($).
This information can be downloaded so users can analyse and deconstruct any element of the ByteTrend score they wish.
What a bullish trend looks like
For demonstration purposes, let’s look at Solana (SOL), one of the leading trends of 2021. Try to calculate its ByteTrend score as shown.
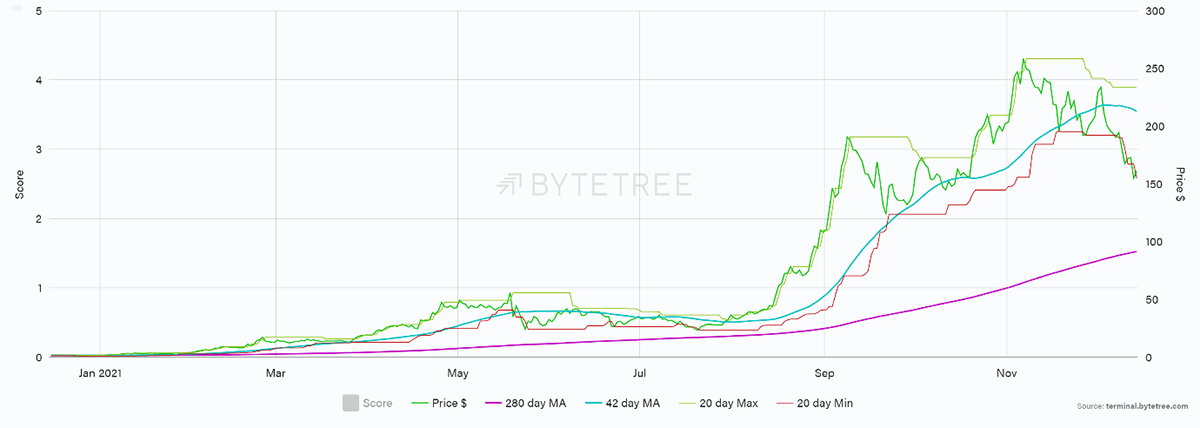
Source: ByteTree. SOL historic trends since January 2021.
SOL ByteTrend score
| 1. Price is above the 280-day moving average | 1 |
| 2. Price is above the 42-day moving average | 0 |
| 3. 280-day moving average slope is rising | 1 |
| 4. 42-day moving average slope is rising | 0 |
| 5. The last touch of the 20-day max/min lines was max | 0 |
SOL’s score is 2/5, and a trend follower would be aware that the trend has weakened from earlier in the month. That is not to say the ascent has ended for good, but it has taken a rest for the time being.
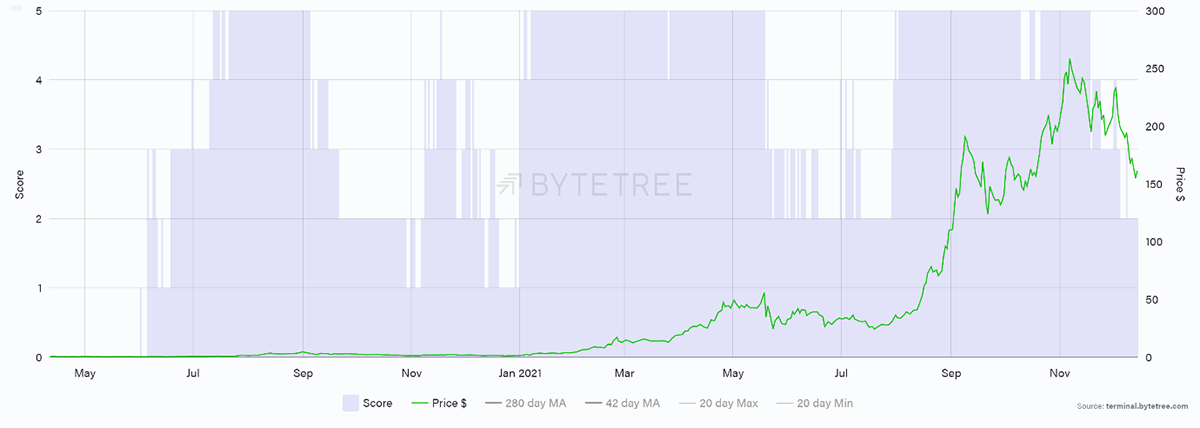
Source: ByteTree. SOL historic ByteTrend score (blue) and price ($).
Most of Solana’s price appreciation occurred when the ByteTrend score was 5. Given a score of 5 occurred 46% of the time, the investor’s capital was free to pursue other opportunities.
Moving Averages
Notice how the moving averages are 42- day and 280-day. These are 30- day and 200-day moving averages, the intended timeframes, that have been adjusted for crypto which trades over weekends. 30 x 7/5 = 42 and 200 x 7/5 = 280.
The simple logic is that the ByteTrend score for a BTC fund or ETF, which trades 5 days per week, would have the same score as BTC itself which trades 7 days. A BTC ETF would use 30- and 200- day ByteTrend moving averages as would traditional assets such as gold and equities.
Summary
Being presented with thousands of crypto tokens, ByteTrend helps investors to sort the wheat from the chaff. Using the simple search function, you can identify and rank trends, which enables your time to be better spent, and your capital to work more efficiently.
View ByteTrend on the Terminal
The ByteTrend Article Series
- Part 1: Introducing ByteTrend: A Trend Following Strategy for Crypto
- Part 2: Finding the Winners in Crypto
- Part 3: The Power of Relative Strength in Crypto
- Part 4: Introducing the ByteTree Crypto Average (BCA)


