Atlas Pulse Gold Report - Issue 69;
The fundamental case for gold is strong. Investors are scrambling for alternative assets, just as they did when the dotcom bubble collapsed in the year 2000. The driver is two-fold: an escape from a bubble and protection against inflation.

Highlights
| Regime | Gold leads equities |
| Macro | Inflation up, expect bond yields to follow |
| Valuation | Still below fair value |
| Flows and Sentiment | Institutions remain heavily underweight |
| Technical | Breakout 5/5 |
Regime
Historically gold has been a buy when two or more of the following have held true:
- Short-term real interest rates are below 1.8%. TRUE
- The gold price, measured in a basket of currencies is rising, measured by a 35-month exponential moving average. TRUE
- The gold price relative to the S&P 500 is rising, measured by a 35-month exponential. CLOSE AT HAND
The last criteria in the regime is now close at hand. In gold’s favour, it is a big ask for it to lead an equity bubble. That has changed.
On 3 January this year, the gold to S&P ratio made its lowest print since 2005. Last year was bad for gold, but it wasn’t that bad as it fell by 3% in dollar terms. That’s a small loss but a big opportunity cost during the late stages of a major stockmarket bubble. This year gold is up 14%, while the S&P 500 is down 13% - how things change.
Gold versus S&P 500 Scores 5/5+
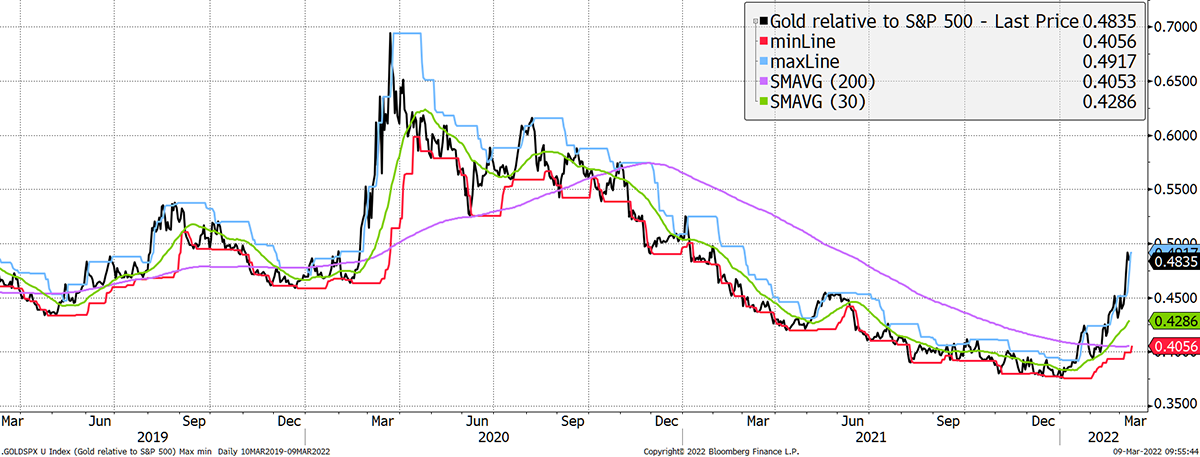
ByteTrend is great because it takes the bias out of charts. That’s incredibly useful not just within investing but also in communication. Please get used to it because I will be introducing the concept into all of my work. You’ll love it once you get your head around it.
Macro
The reason for gold’s recent outperformance is generally attributed to the invasion of Ukraine. That has been the event, as it has caused commodity prices to spike, which means higher inflation. Yet we should remind ourselves that inflation has been brewing for some time.
This fabulous chart from Bloomberg breaks US CPI down by contribution from services, goods, food, and energy. Services (blue) were stable but have risen to a five-year high. Goods (orange) have switched from being a deflationary contributor pre-2020 to a major source of inflation. Food (yellow) is just waking up, and given the surge in wheat, expect much more to come. Finally, there’s energy (green, ironically), which has reawakened from negative prices in 2020. None of these pressures will fade away soon.
Inflation Breakdown
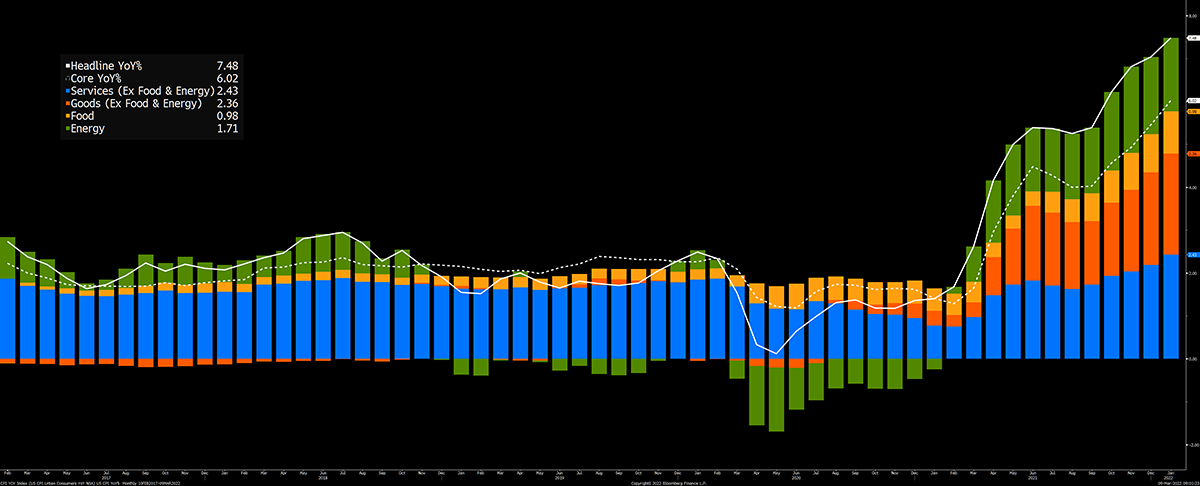
The supply chain had seen problems stemming from Covid-19 with the assumption they would pass sooner or later. They didn’t because just as shortages are resolved in one area, they soon popped up somewhere else: a bit like the children’s game Whack-A-Mole.
Inflation expectations have surged. The piece that investors should pay attention to is the change in the long-term expectations that impact asset prices. The 30-year reading has made a ten year high.
Short-term Expectations Have Rightly Surged
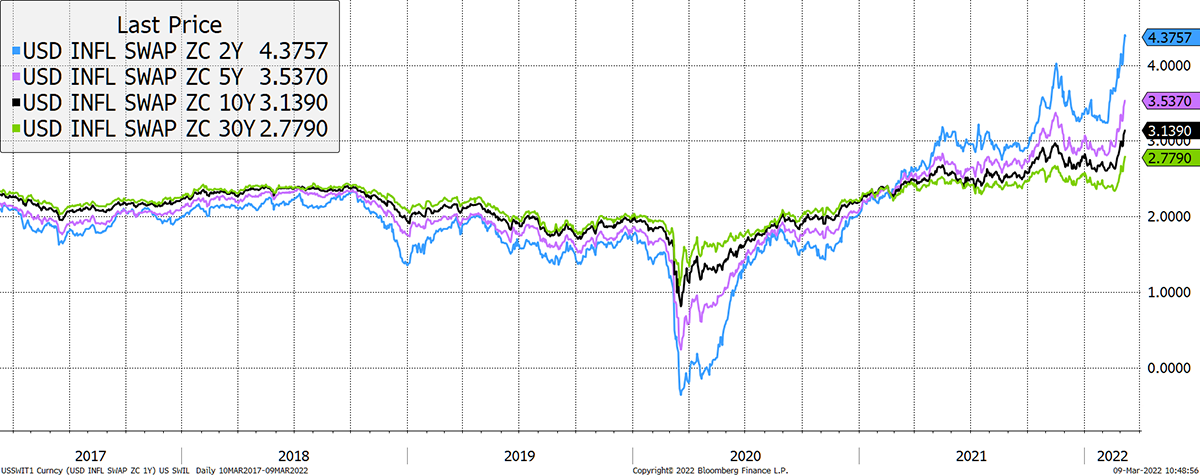
Gold likes inflation to rise, but it also likes rates to remain low, especially long-term rates. The two- and five-year rates are rapidly rising, which has caused the yield curve (difference between long- and short-term rates) to flatten. This normally indicates a recession is coming. No surprise there given the circumstances as economies always stumble on high energy prices.
In the early days of the war, there was a strong bid for US treasuries, but this demand is already waning. It is not unreasonable to expect bond yields to rise. As sooner or later, the bond market will have to accept that inflation will be with us for much longer than we expect.
The Risk-off Move in Bonds was Short-lived
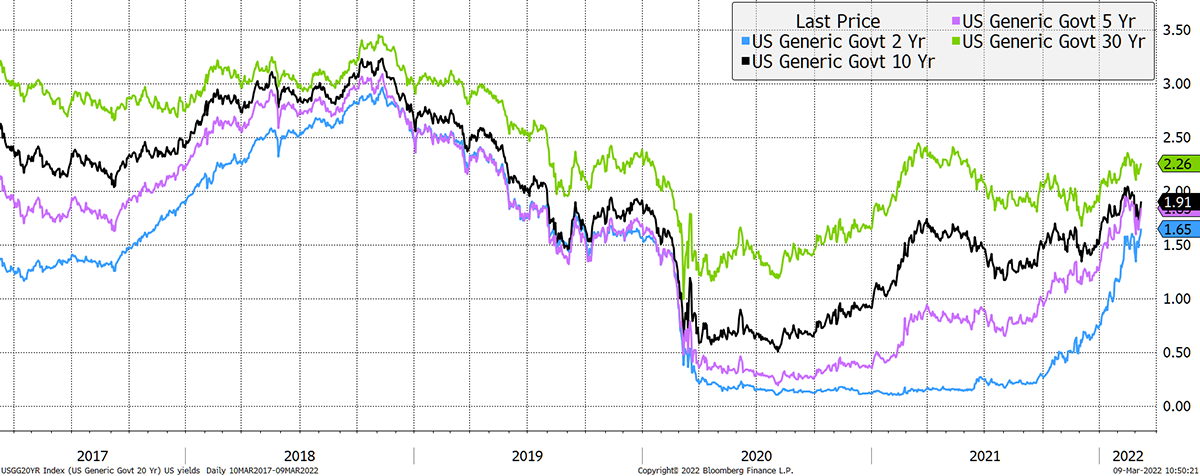
The point of all this is that gold likes real yields (rates less inflation) to be falling. As rates have remained stable with inflation spiking, real yields have resumed their downtrend. So long as that keeps on happening, expect gold to break out to a new all-time high.
Real Yields Have Fallen
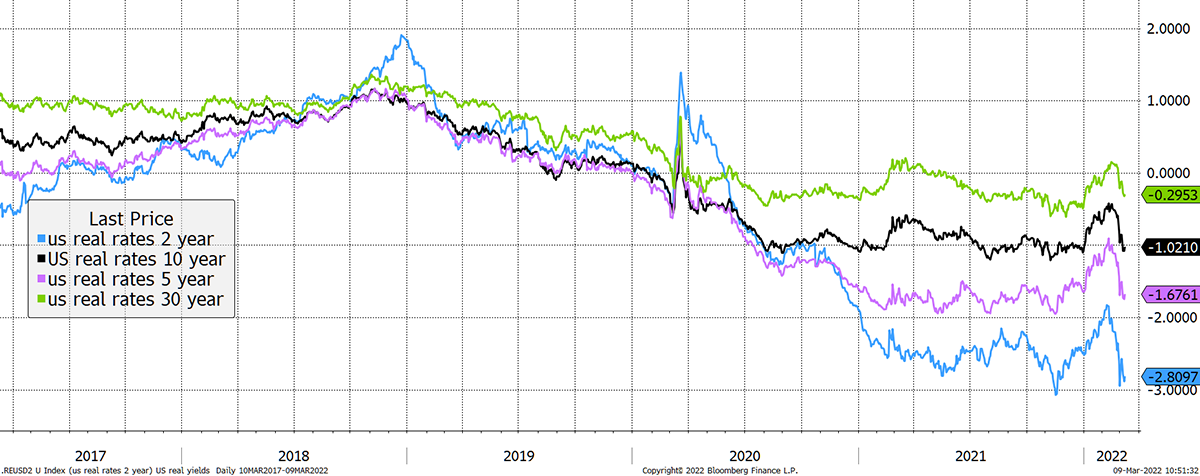
The remarkable thing is how gold has advanced while the dollar has been strong. This simply means that gold is in play. Normally gold and the dollar move inversely simply because gold is quoted in dollars. One goes up, and the other goes down. As things stand, the case for gold has come to light and gold’s strength overwhelms the dollar’s strength. If low real rates can coexist with a softer dollar, then expect dollar gold to fly.
Valuation, Flows and Sentiment
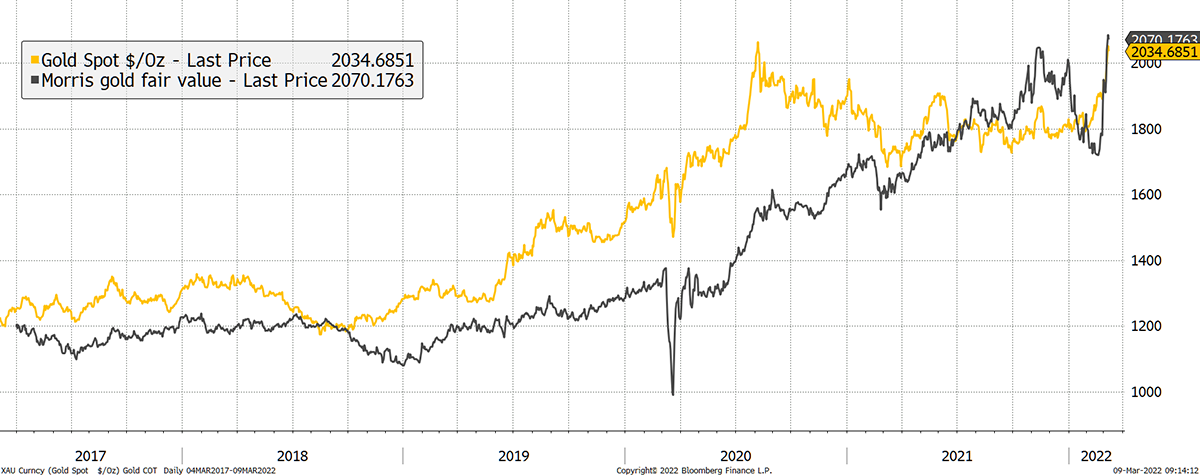
It is widely accepted that real rates drive gold, and that it is a long term store of value. My gold fair value model takes these ideas into account, and the objective is to see where we are. Currently, gold is trading in line with fair value.
Gold Is Still in the Fair Value Range
Flows
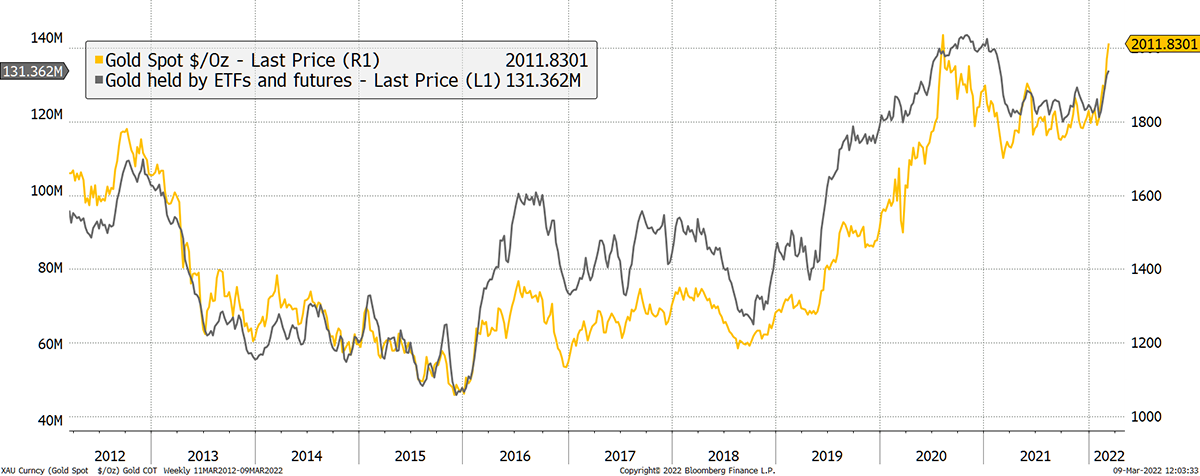
Investors are once again allocating to gold, and we are some way off extremes that we will inevitably see. The recent price move has moved in sync with inflows which is further evidence that the price response is rational. The flows shown combine the ETFs with the futures market, which is a reasonable measure of institutional involvement.
Investors Are Buying Gold
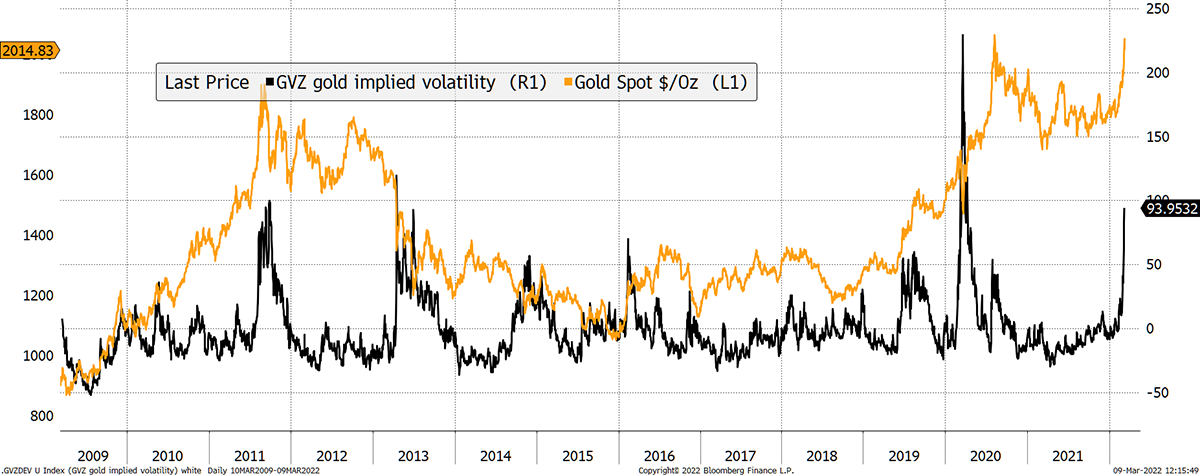
One chart worth keeping an eye on is gold’s VIX. The GVZ index is derived from option prices and highlights market madness. Clearly, volatility has risen across the board, but we should remind ourselves that gold’s move is no longer a quiet affair, and the cat is out of the bag. Gold will cool if markets resume a risk-on stance.
Volatility Spikes Can Signal Turning Points
If there is a move to risk-on, then ByteTree is a big fan of bitcoin. We have been highlighting how bitcoin has been a better bet than equities this year. I write about this each week in ATOMIC. Please have a look if you want to learn more - details on a 30-day trial in the footer below.
I show GVZ compared to its 200-day moving average to highlight the spikes and the reversion to mean when things calm. The current reading for GVZ is 93% above trend, which is up there with 2011. But recall that in March 2020, this didn’t seem to matter.
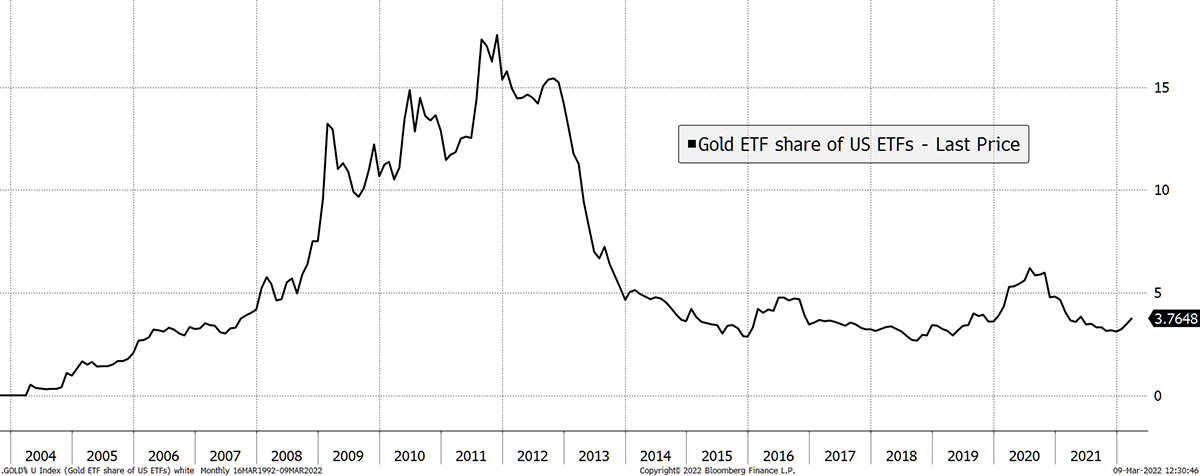
One reason is that the institutional investors are still heavily underweight gold and are behind the curve. Today, the US ETF industry controls circa $5.5 trillion of assets. At the last major gold peak in 2011, the total ETF assets were $0.83 trillion and gold enjoyed a 17.6% share of that market. Today, gold represents a measly 3.7% of total assets.
Plenty of Room for Asset Allocators
Summary
Arcane Research highlighted that the two leading gold tokens, Paxos (PAXG) and Tether Gold (XAUT) now have over a billion dollars in assets. The ETFs have $205 billion, so there is some catching up to do, but given crypto has sucked in almost $200 billion in US dollars through stablecoins, I’m sure it will get there. Crypto is not in competition with gold, and it is great to see the space embracing it and becoming another source of demand.
The fundamental case for gold is strong. Investors are scrambling for alternative assets, just as they did when the dotcom bubble collapsed in the year 2000. The driver is two-fold: an escape from a bubble and protection against inflation.
Investors have become used to risk-off conditions leading to a deflationary shock, but things have changed. This time, inflation is the problem, and traditional bond-equity portfolios (often with an ESG bias) are poorly positioned for this new era. We’ve seen the start of what I believe will turn out to be a sustained advance for gold.
I’m bullish. Thank you for reading Atlas Pulse.
Thank you for reading Atlas Pulse. The Gold Dial Remains on Bull Market.
Charlie Morris is the Founder and Editor of the Atlas Pulse Gold Report, established in 2012. His pioneering gold valuation model, developed in 2012, was published by the London Mastels Bullion Association (LBMA) and the World Gold Council (WGC). It is widely regarded as a major contribution to understanding the behaviour of the gold price.
Please email charlie.morris@bytetree.com with your thoughts.


