Atlas Pulse Gold Report - Issue 72;
By definition, a liquid inflation hedge must be somewhat detached from the financial system and is unlikely to pass ESG screening with flying colours. You could point to inflation-linked bonds, but if things went badly wrong, they would be first in line for default.

Highlights
| Macro | Dr Copper and Professor Gold |
| Valuation | What lies behind the gold price |
| Bitcoin | It’s time to engage |
| BOLD1 | The superior and liquid alternative asset |
Many investors don’t believe there is a clear framework for making sense of gold. I know this because they believe it has failed to protect them during the recent burst of inflation.
I would argue that gold saw this episode coming by rewarding investors back in 2020 on the mere sniff of balance sheet expansion (money printing). Gold went too far and cooled just as Dr Copper woke up from a deep sleep.
I would say that if Dr Copper has a PhD in economics, and is an expert on the business cycle, then gold is a professor with a Nobel Prize in monetary debasement.
When you look at gold and copper from 30,000 feet, they appear to be correlated. That shouldn’t surprise you as they are both commodities.
Dr Copper and Nobel Prize Winning Professor Gold
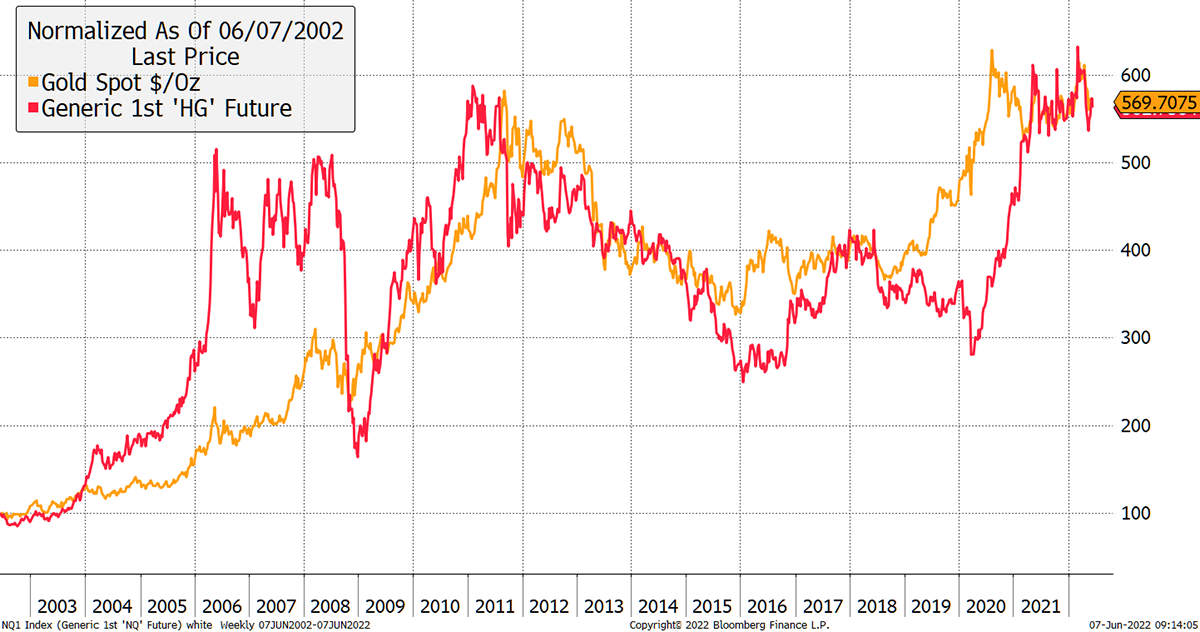
Yet the difference between gold and copper is revealing as it reflects risk-on versus risk-off market conditions. In 2008, gold and copper both fell in USD terms, yet gold fell much less and so rose on the chart versus copper. In the 2009 recovery, that was reversed.
We have seen the same behaviour in 2019/20, where gold won the risk-off and copper the risk-on. With the ratio at 4, and the line rising in favour of gold, it is a clear reminder that risk-off is here and could last for a year or two.
Gold Back in Line Against Copper
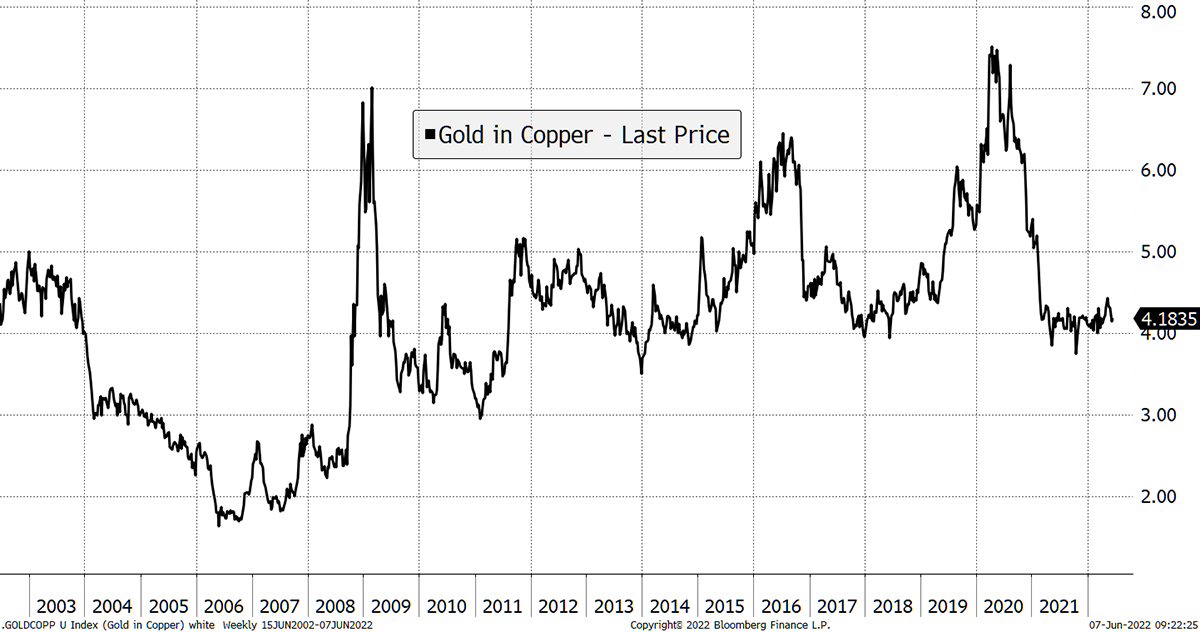
It is possible that gold cheapens against copper as it did in 2006, but I don’t see it. More likely, gold starts to respond positively to the risk-off inflation, while copper prepares for the next risk-on period in a year or two from now.
I say that with confidence because understanding why gold trades where it does, is key to understanding where it might go.
In this exercise, I have broken down the gold price by the four major factors that drive it, at least in USD terms.
Gold is as rational an asset as there could ever hope to be. There are three important price drivers, with the fourth being the madness of crowds:
- Past inflation
- Present value
- Future expected inflation
The crowds overdo bull and bear markets, just as they do in every other asset class. I call that the gold premium or discount. If you have a framework for valuing gold, or any other asset, then the crowds work to your advantage as you can apply a value investing approach.
The table below attributes the drivers behind the gold price move and how it got there. The fall in real rates from 3.1% in May 2002 to 0.4% today has boosted the gold price by 70%. Not far behind that is actual (realised) inflation, which has totalled 60% over the period. That means a dollar in 2002 will buy you 63 cents of goods today. We called that an era of low inflation, so wait until you see what’s coming.
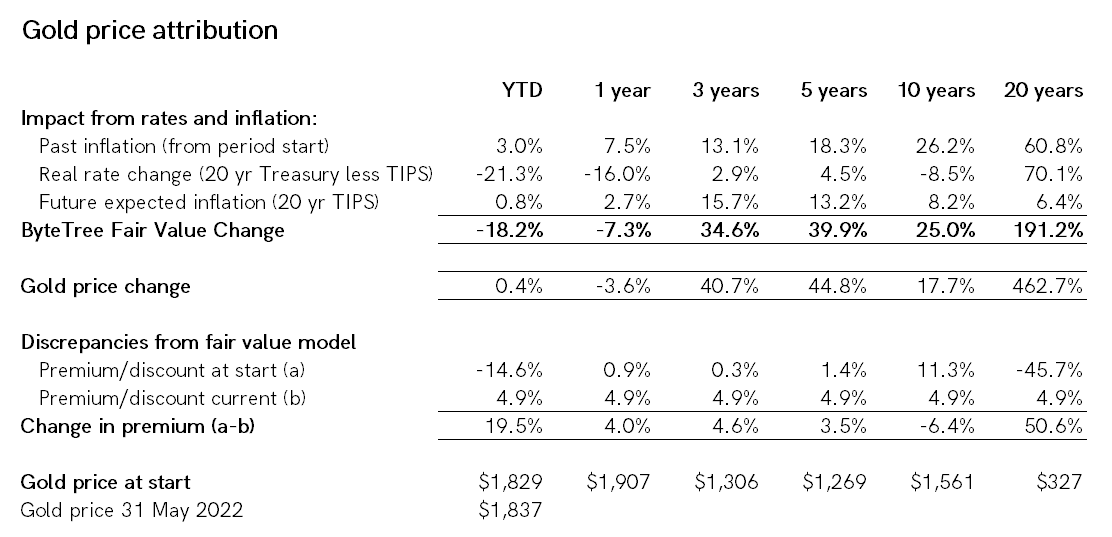
Most would agree that gold compensates for past inflation or debasement, and some understand the importance of real rates (rates less inflation).
The bit that people miss is future inflation expectations (breakevens). These tell us what the bond market assumes future inflation will be, given all the available information, sourced from the price of TIPS.
Breakevens Have Traded in a Tight Range for Two Decades
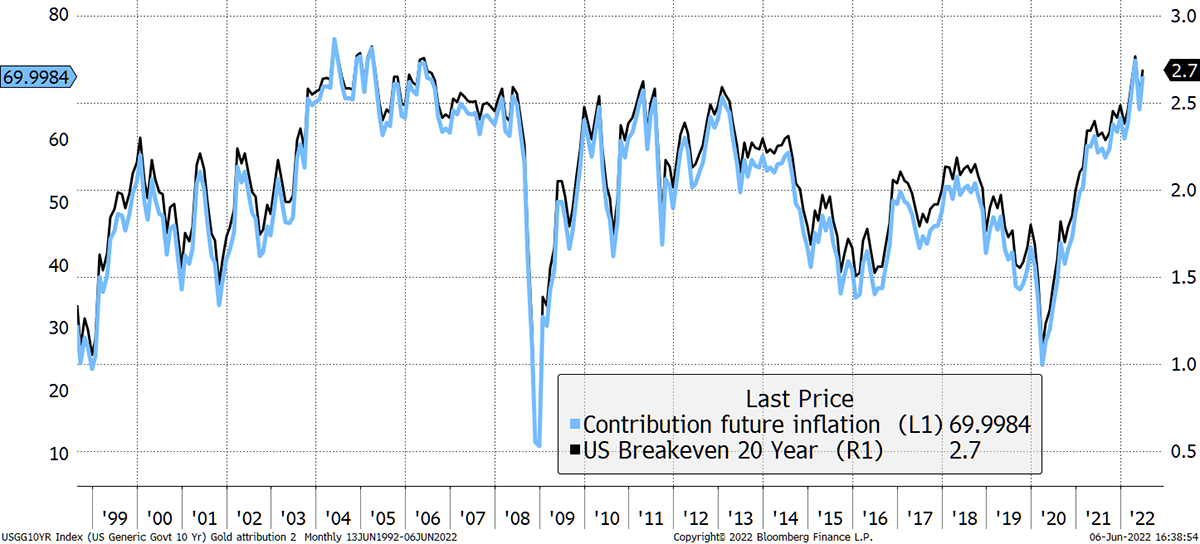
Take the current 2.7% breakeven and now look at the left axis. That shows you the impact of future expected inflation on the gold price. 2.7% per year (expected according to TIPS) for 20 years puts 70% onto today’s gold price, in contrast to expected inflation having been zero.
From the March 2020 low (Covid), the rise in inflation expectations has been the main driver of the gold price, while the rise in bond yields has been a drag. I break it down.
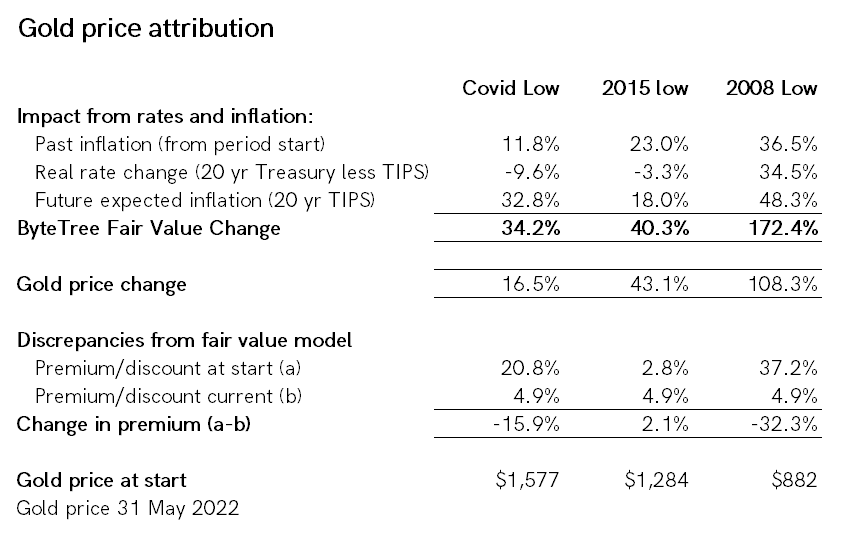
There has also been a revival in actual inflation – a whopping 11.8% since April 2020. Gold protects you from this as well, which is often forgotten. When actual inflation is high, it can be a considerable tailwind for the gold price.
Yet most analysts point to real rates as the main driver of the gold price simply because there is a clear and visible negative correlation. At times, that has been right to do so, especially when real rates have moved, such as during the periods highlighted.
Gold Moves Inversely to Real Rates, but That Is Just One of Four Drivers
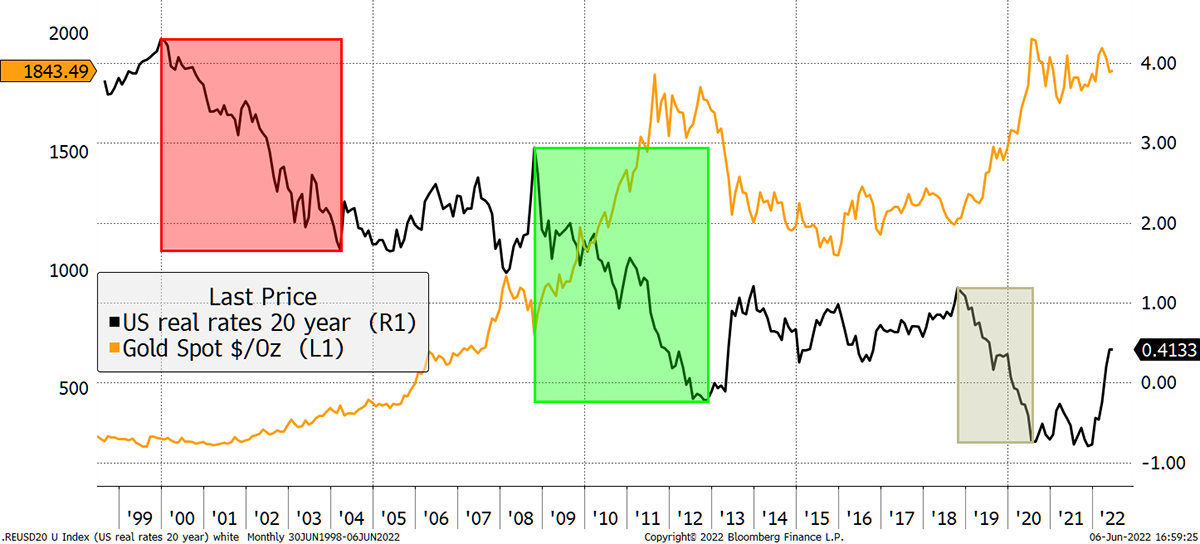
There were times when real rates rose and caused gold to fall without an inflation slump, such as the 2013 taper tantrum.
This year, real rates have moved higher, while inflation expectations have done little. That’s the “inflation is transitory” thesis. Yet despite this painful move in real rates, gold has been saved because it was under-priced at the beginning of the year. The reduction of the fair value was offset by a low price, to begin with.
Once again, Professor Gold saw it all coming, and today, the premium is less than 5% which is negligible. Better yet, the killer for gold, other than deflation, is rising rates, and much of that is already priced in, at least for the time being.
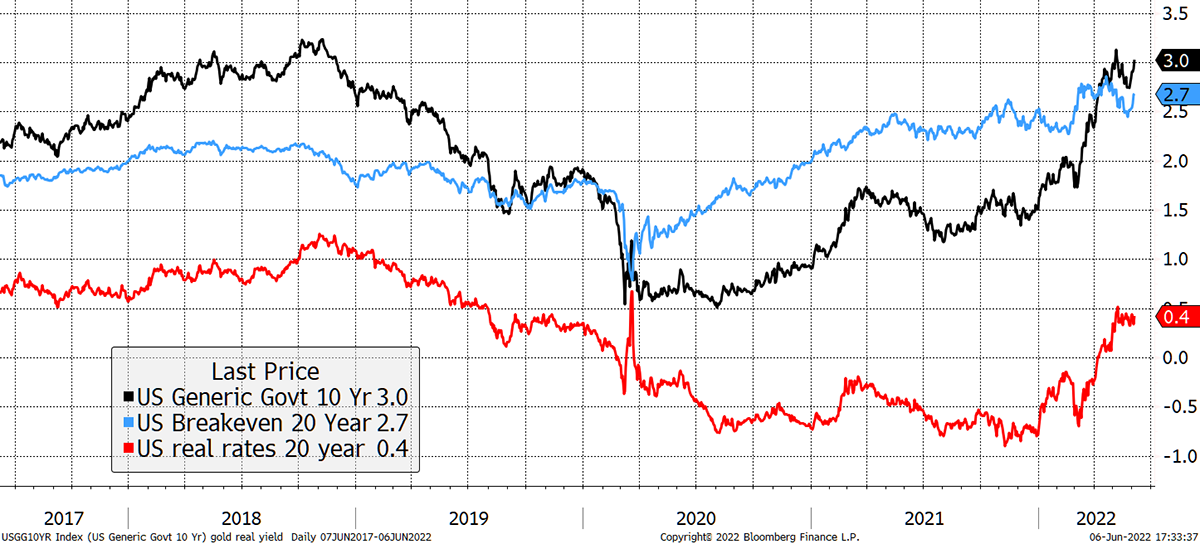
Moving from a 0.8% bond yield to a 3.1% yield was the most painful bit. The central banks know that a large spike in real rates will crash asset prices, not just gold, so they will probably underdeliver when it comes to fighting inflation.
Assuming the central banks have a plan, it will presumably be to allow the bond yield to rise just enough to be seen to contain inflation. Unfortunately for them, inflation expectations (blue) are not falling; they are rising. They know that a 1% real yield with a 3% bond yield caused a price collapse in late 2018, so they’ll have to take that into account in further rate hikes.
Approaching the Danger Zone for Rates
As I keep on saying, all roads lead to gold (and Bitcoin).
And then, of course, we should consider the dollar, which has been strong. Let’s not forget that those not playing by the rules will see a brutal devaluation of their currency. Gold may be down 4% in dollars over the past year, but in Rupees, it’s up 4%, in euros, up 10% and in yen, up 17%.
Major Currencies Are Coming Under Pressure
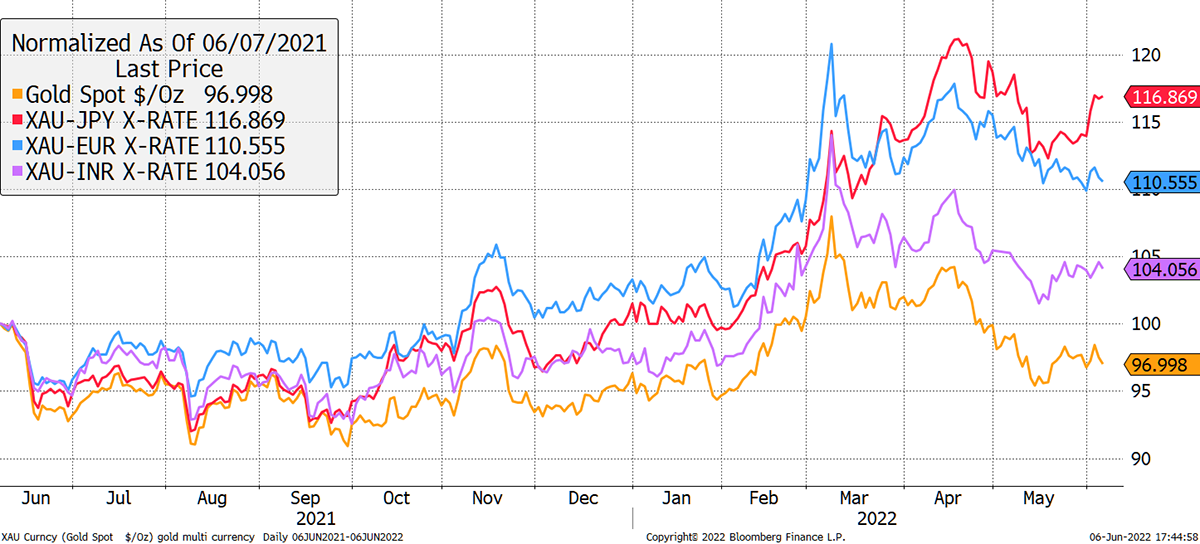
One prediction I can make with conviction is that currencies will continue to come under pressure. When rates and inflation are zero, there is no need for currency volatility because rates and inflation are the same. It is when they start to differ that things become interesting.
That nicely leads onto Bitcoin. To clarify something, I don’t see it as a currency, just like I don’t see gold as a currency. They are alternative assets, both of which behave like commodities.
Bitcoin
I first described bitcoin on these pages in November 2013. I was beyond excitable, and nine years later, I believe ByteTree has the best framework for understanding Bitcoin of any company in the world.
It’s not perfect, and we still have much to learn, but I have never before been so confident in saying that bitcoin is real. It will become ever more relevant for mainstream investors and will continue to grow for years to come.
In this report by Chainalysis, a compliance and on-chain data company, they rank the top 20 countries by bitcoin adoption. The only developed nation that appears is the USA.
The 2021 Global Crypto Adoption Index Top 20
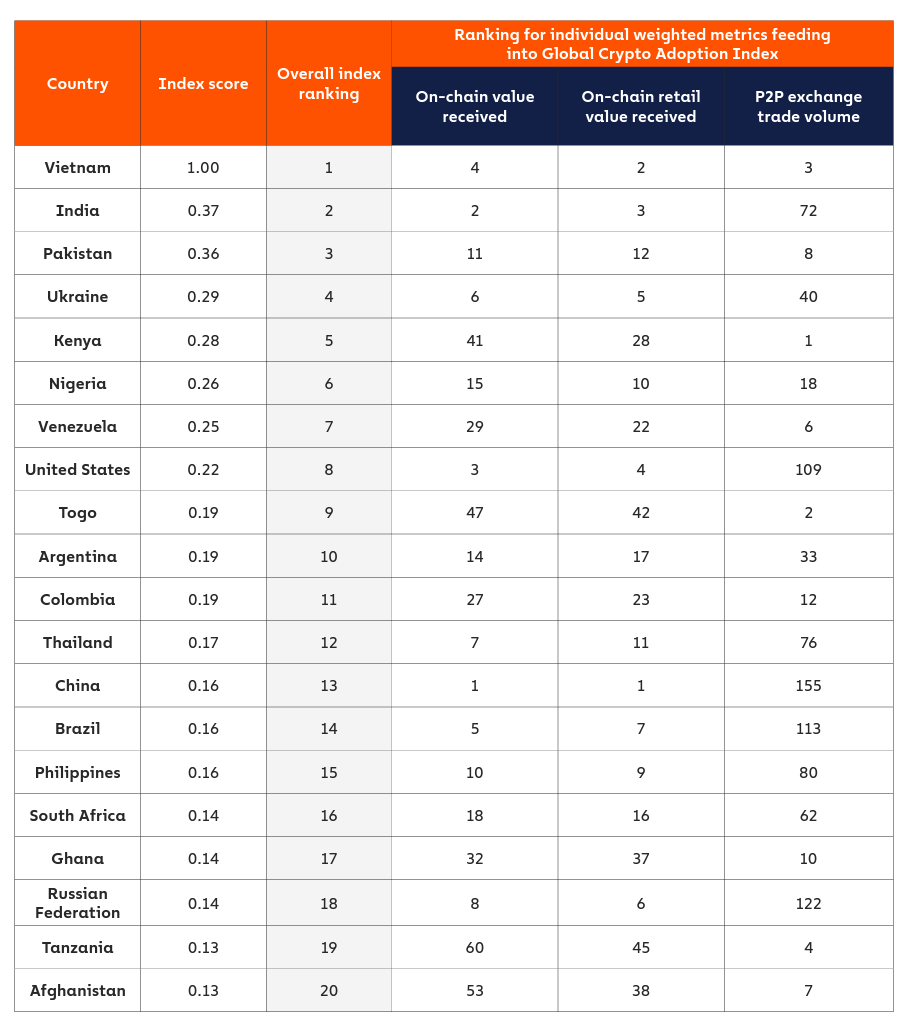
For those still wondering what bitcoin’s use case is and why it isn’t a Ponzi scheme, perhaps look no further than this megatrend. Bitcoin is a growing alternative asset for an increasing part of the world’s population.
Is Bitcoin the New BRIC?
In my opinion, bitcoin is different from gold and not in competition with it. Apart from the obvious physical differences, gold adheres to a rational macro-economic framework, while bitcoin’s value derives from its network and growth.
ByteTree cracked this some years ago. It wasn’t easy to process each of the 739,500,255 transactions since 2009 to measure the bitcoin economy, but we did it.
As each block comes in, we break down the transaction by type to find the ones we deem to be economic. We then deduct change to estimate the amount of value moving across the blockchain. Sounds easy, but the computer alone cost us £20,000, not even knowing what we’d find.
When you think about it, bitcoin has one job, and that is to transfer value. The increased confidence over the years has seen this value-transferring network thrive. In the bear years of 2014 and 2018, that network contracted sharply. In this bear year, 2022, it is alive and well.
Bitcoin and ByteTree Fair Value
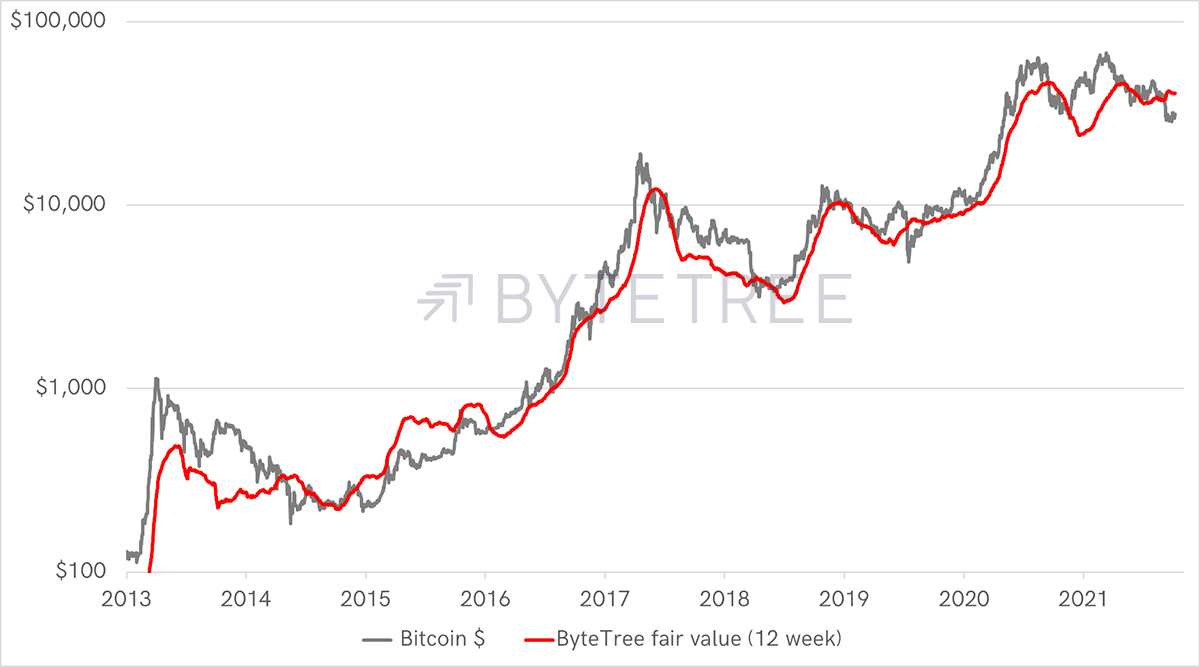
The difference between bitcoin in 2022 and years past is that the on-chain transfer value is around $43 billion/week (12-week average). When my co-founder, Mark Griffiths, first cracked this dataset on 31 July 2014 (I was on holiday and salivating over my laptop, to my family’s dismay), this same number was $300 million/week. The bitcoin network has grown substantially, and it is real.
The best bit is that in 2022, the network (red line) has remained stable despite the crash in price. This demonstrates that millions of people living in those countries above are actually using bitcoin, not just speculating in it. That is the great change.
Last year, we did witness a temporary collapse in the bitcoin network, when China added a layer of regulations (or banned bitcoin?), particularly around mining. Remarkably, the recovery was quick, underlying the robustness of the network.
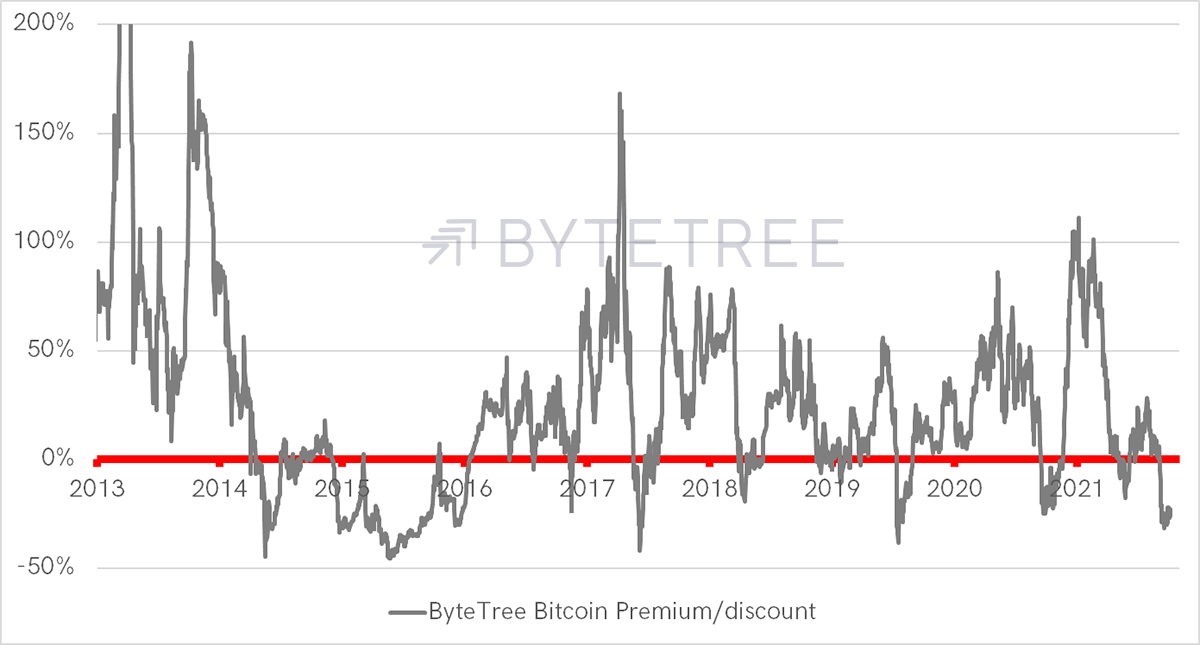
Looking at the premium/discount, there was a bubble in bitcoin last year, but it is already behind us. ByteTee’s bitcoin fair value is $40,713, and it is trading at a 23% discount.
The Bitcoin Bubble Is Behind Us
Bitcoin + Gold = BOLD
What bitcoin and gold have in common is that they are both hard assets. Gold tends to see a premium building during risk-off and bitcoin during a risk-on. This is not dissimilar to Professor Gold and Dr Copper, except that bitcoin remains in growth mode. Quite simply, it has the potential to do much better.
The Vinter ByteTree BOLD Index (BOLD1 on Bloomberg or Refinitiv) brings together these remarkable assets on a risk-weighted basis. This means that each month, the index allocates on an equal risk basis.
On an excitable trading day, you might see Bitcoin move by 5% and gold by 1% (often in the other direction). With approximately 80% in gold and 20% in bitcoin, the perils of volatility soon dissipate.
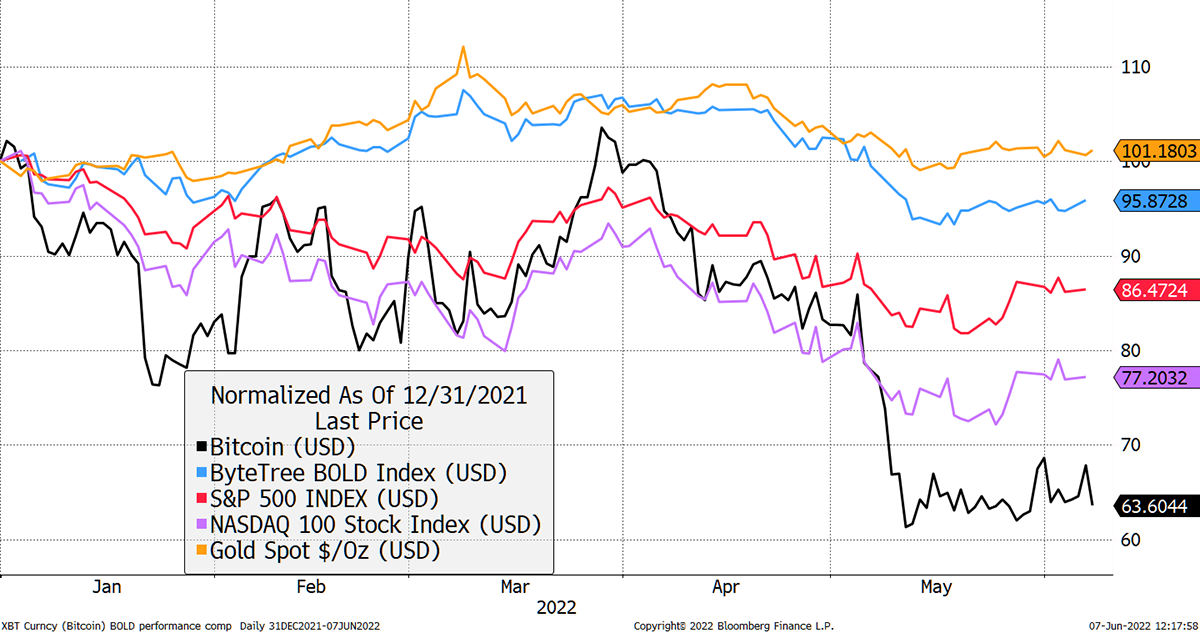
People assume that BOLD has been troubled this year, but it hasn’t. BOLD1 is down by 4.1% in USD, which means it is up in most currencies. That is despite bitcoin being down by 36%. Rebalancing has played an important role in capturing excess returns. By selling the higher asset and buying the lower each month, I estimate that to be around 6% to 7% per year, but that does depend on the path the assets follow.
BOLD1 Is Doing Well in 2022
Yet during the good times, BOLD1 did well too. The March 2020 correction was mild, and it distanced itself from gold after the August 2020 peak. BOLD1 has a habit of aligning itself to the winner. I have removed bitcoin because it ruins the chart (yes, it went up a lot – it does that).
BOLD Lead the Bull and the Bear
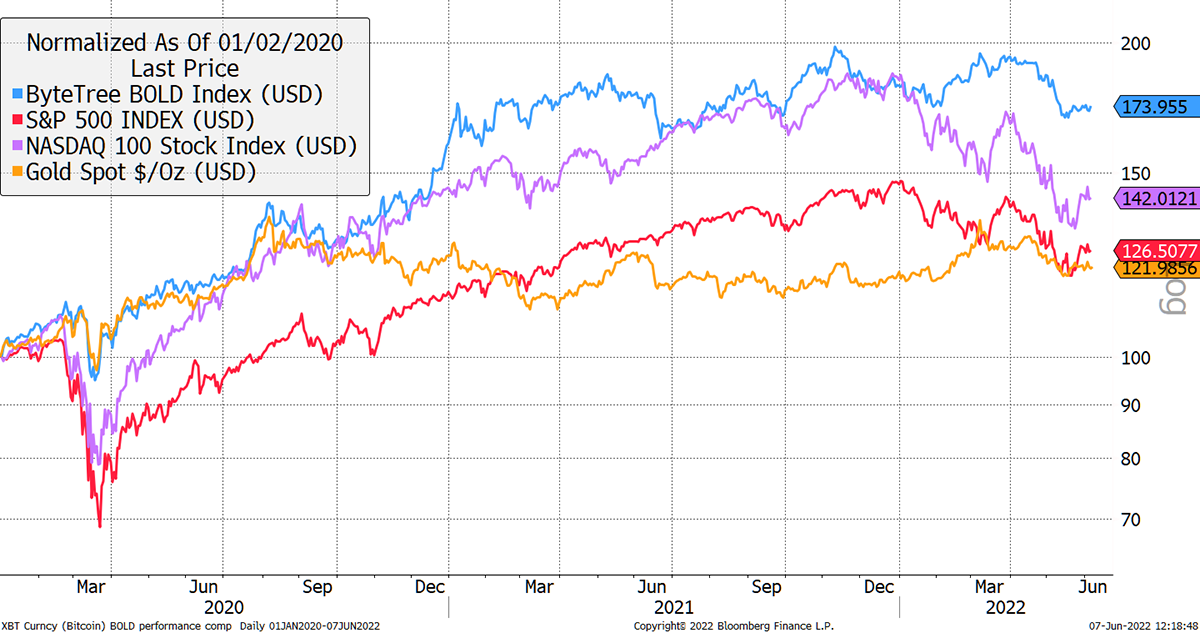
What about risk? BOLD1 has remained less volatile than the stockmarket during the last three corrections. Q4 2018, when the Fed was hiking the last time, that shook equities. Then the March 2020 Covid crash, and again this year.
BOLD1 Has Remained Calm During Storms
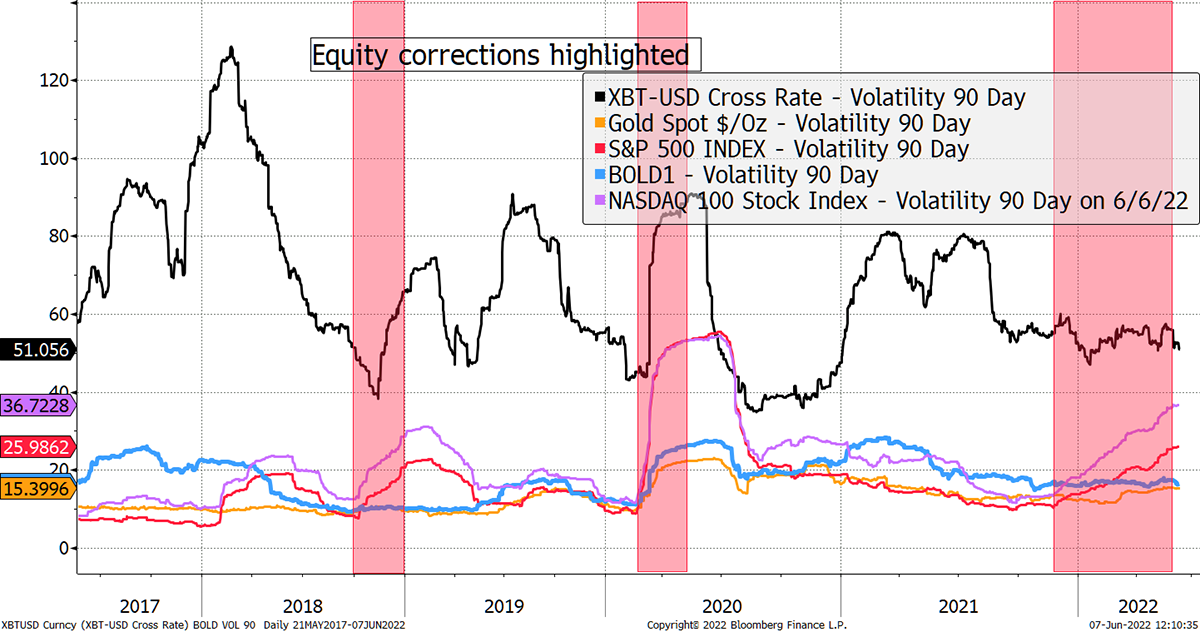
On all of these occasions, BOLD1 has remained significantly less volatile than equities. In fact, BOLD1’s volatility has historically picked up during equity bull markets rather than bears. That is when gold sells off, and bitcoin has flown.
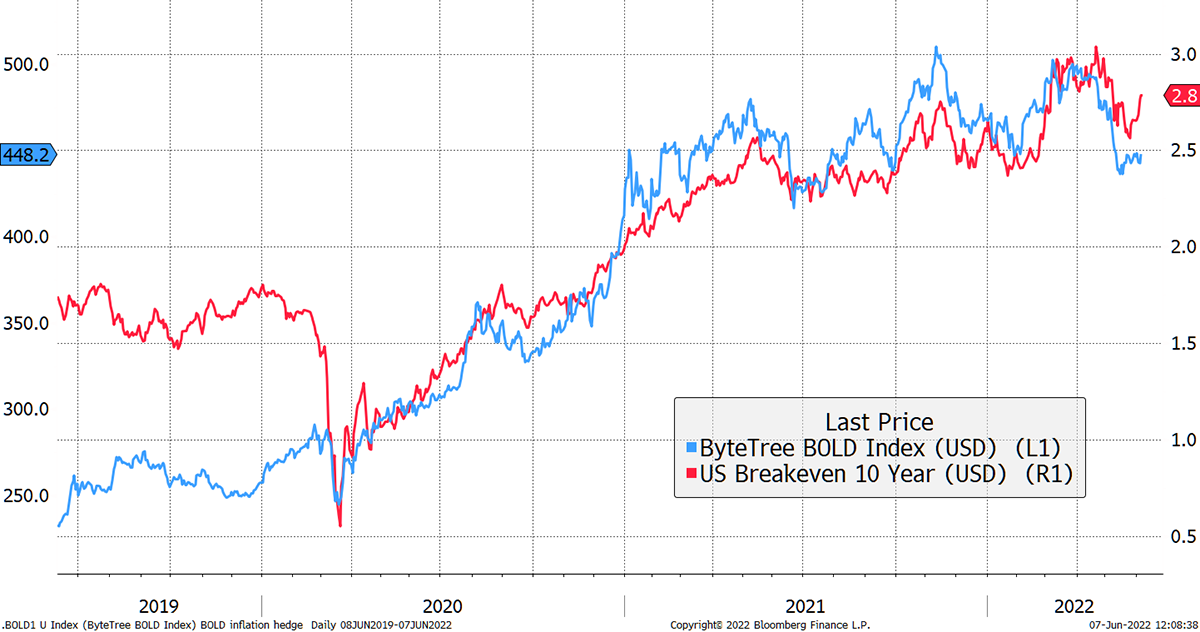
Bitcoin and Gold are both hard assets, which have an appeal during times of inflation. This is more of an outcome than an intended part of the design, but BOLD1 has been the closest thing I have ever seen that resembles an inflation hedge.
Investors were moaning that gold had failed in 2021 and bitcoin had failed in 2022. I would point out that pretty much everything is an inflation hedge when it is cheap, whereas nothing is when it is dear.
The beauty of the bitcoin and gold combination is that it is hard to imagine them experiencing a bubble at the same time.
BOLD the Inflation Hedge
BOLD is remarkable as it blends the old world’s store of value with the new. Gold trades $145 billion/day (World Gold Council) whereas Bitcoin trades $40 billion/day (on-chain, CME Futures and crypto exchanges).
Bitcoin and Gold are the two most liquid alternative assets in the world. They are not in competition, play different roles, have global cross-border and cultural appeal, and come together as an all-weather inflation hedge.
Please have a look for yourself, and feel free to download the BOLD1 Index for your own analysis.
Summary
Having a bubble at the same time has been a major problem for bonds and equities this year. They are supposed to be different, but not when the central banks print money like they have just done.
The 1970s were brutal for the 60/40 equity/bond portfolio as higher inflation meant lower valuations. Those who engaged with gold and commodities survived; those that didn’t suffered.
By definition, a liquid inflation hedge must be somewhat detached from the financial system and is unlikely to pass ESG screening with flying colours. You could point to inflation-linked bonds, but if things went badly wrong, they would be first in line for default.
The future value of gold, as described above, is the same framework for inflation-linked bonds. I think if things got really bad, they would soon become political and moral kryptonite.
In contrast, Bitcoin and Gold can’t default because they are no one’s liability. That is the beauty of liquid alternative assets.
Thank you for reading Atlas Pulse.
Thank you for reading Atlas Pulse. The Gold Dial Remains on Bull Market.
Charlie Morris is the Founder and Editor of the Atlas Pulse Gold Report, established in 2012. His pioneering gold valuation model, developed in 2012, was published by the London Mastels Bullion Association (LBMA) and the World Gold Council (WGC). It is widely regarded as a major contribution to understanding the behaviour of the gold price.
Please email charlie.morris@bytetree.com with your thoughts.


