Absolute and Real Returns for the ByteTree BOLD1 Index
Disclaimer: Your capital is at risk. This is not investment advice.
ByteTree BOLD
We published the first monthly BOLD1 Chart Book last week, and Dr Peter Warburton wrote in:
“Fabulous slide pack. I suppose the remaining questions are:”
a) how likely is it that BOLD1 will make an absolute return?
b) how likely is it that BOLD1 will make a positive real return?
Dr Peter Warburton is director of Economic Perspectives Ltd, an international consultancy, and managing director of Halkin Services Ltd. He was an economist to Ruffer LLP, an investment management company, for 15 years and spent a similar length of time in the City as an economic advisor and UK economist for the investment bank Robert Fleming and at Lehman Brothers. Previously, he was an economic researcher, forecaster and lecturer at the London Business School and what is now the Bayes Business School. He published Debt and Delusion in 1999. He has been a member of the IEA’s Shadow Monetary Policy Committee since its inception in 1997. He is a contributor to the Practical History of Financial Markets course run by Didasko, an education company at Heriot-Watt University, and occasionally teaches at Cardiff Business School.
Thank you, Peter, for these excellent questions that get straight to the point.
How likely is it that BOLD1 will make an absolute return?
We should assume that after thousands of years, gold is here to stay. We cannot make the same assumption for bitcoin because, despite extraordinary value creation, its future is uncertain.
That said, reports of its death have been greatly exaggerated, and in my opinion, it will grow as more people see it as an alternative hard asset, with technological applications. According to Chainalysis, Bitcoin is a global movement, with 19 of the 20 most active countries being emerging markets. The 20th is the USA.
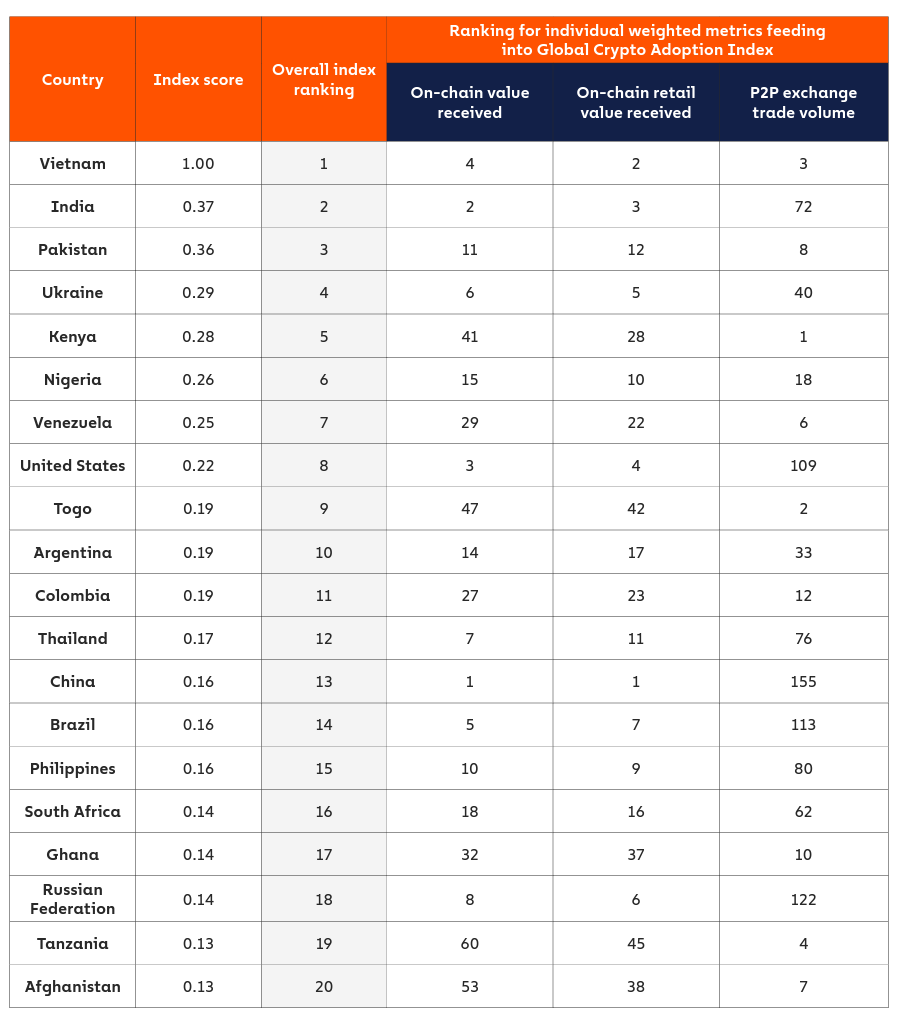
Source: Chainalysis
In 2015, ByteTree established the proportional link between transaction value and the bitcoin price and our data measure this.
In 2013, the network saw $10bn change hands, and in 2021 this surpassed $2tn. The log scale demonstrates how extraordinary the growth rate has been.
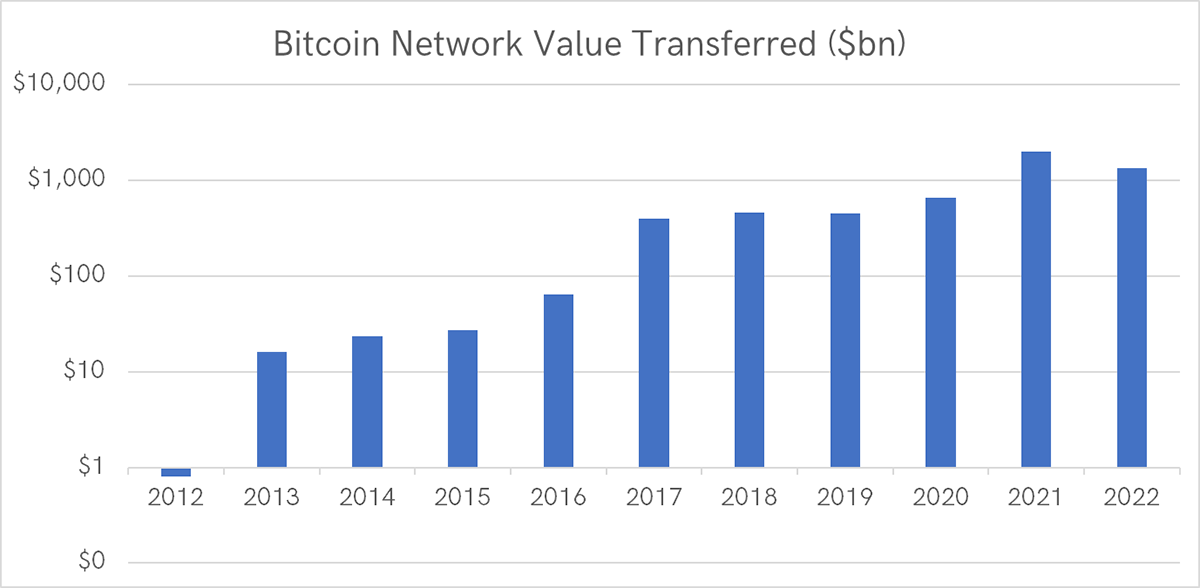
Source: ByteTree
At the current rate, the network will see $1.33bn change hands in 2022, a 33% contraction from last year. That said, this is a low-ball forecast, as Q2 has been particularly brutal. This is more likely to be adjusted upwards than downwards.
The previous network contraction, of 3%, occurred in 2019, as it settled down after the 2017 bubble. The growth rate in transaction value has been 163% p.a. since 2013 and 127% p.a. since 2017. These are large numbers, and their growth is similar to the change in price.
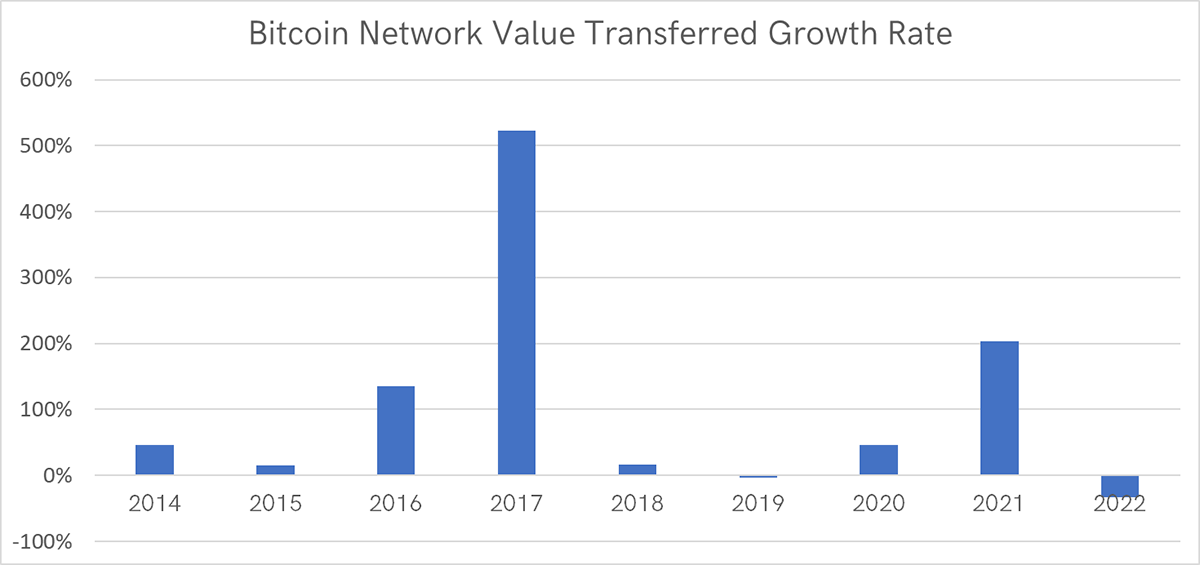
Source: ByteTree
If bitcoin were to fade away, transaction value would fall dramatically, and price volatility would rise. Even after a painful second quarter, volatility has remained much lower than in past bull and bear markets.
Bitcoin Volatility Falls as Liquidity Rises
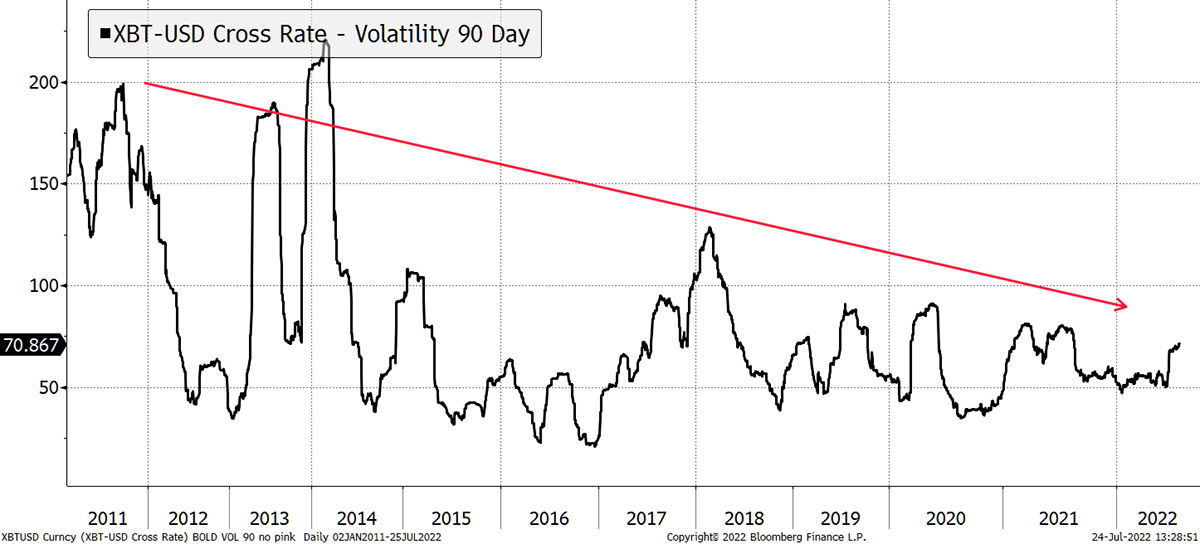
Source: Bloomberg
This evidence demonstrates that bitcoin is not going away and remains a growth asset.
Using 360-day volatility, bitcoin has spent over three years hovering around 60%, with gold typically around 15%. As a reflection of their relative volatilities, the BOLD1 Index is typically exposed to approximately 20% in bitcoin and 80% in gold.
Measuring the 360-day Volatility to Create the BOLD1 Index
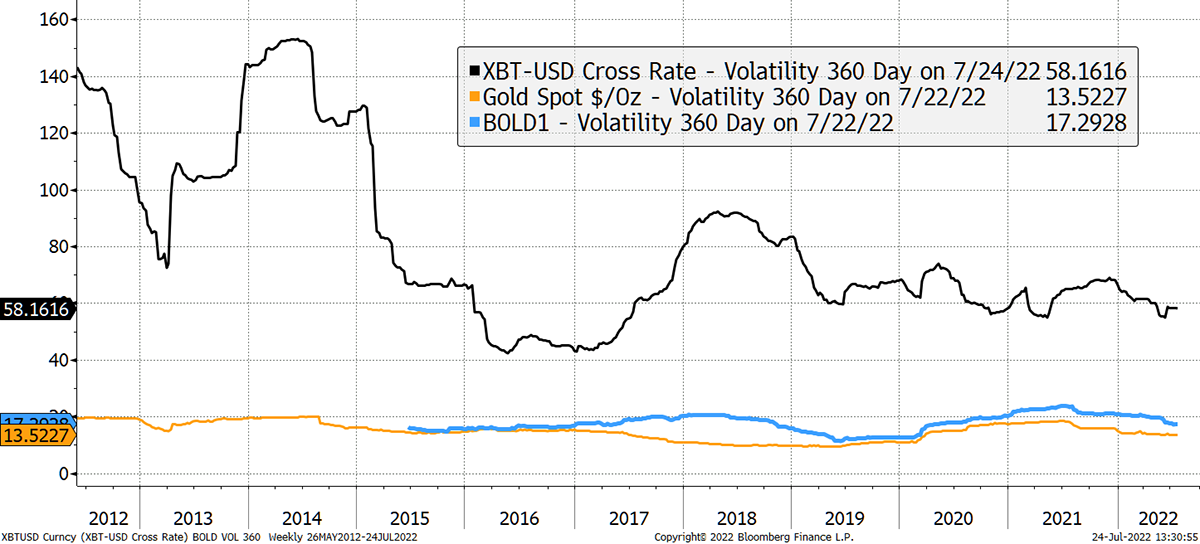
Source: Bloomberg
Just as a 60/40 portfolio balances risk with 60% in equities (risk-on) and 40% in bonds (risk-off, but not in 2022), BOLD1 balances bitcoin with gold. These are two of the most liquid alternative assets and are combined on an equal risk basis.
Bitcoin is relatively new, but we can be sure it is a risky asset that generally correlates with equities and the tech sector in particular. In this test, I replace bitcoin with the MSCI Global Equity Index TR since 1970. BOLD1 becomes “SOLD” (stocks and gold).
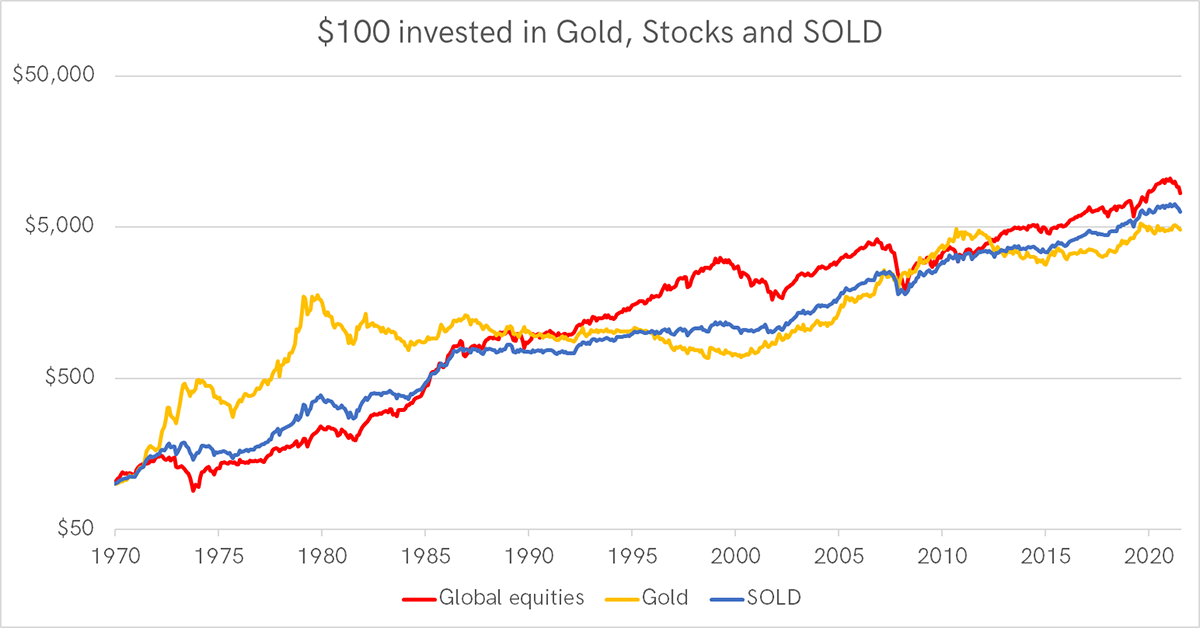
Source: Bloomberg, ByteTree
SOLD’s record in achieving a positive return is excellent, despite the 1980 to 1999 gold bear market and the various equity sell-offs. $100 invested into each became $8,399 in stocks, $4,827 in gold and $6,349 in SOLD. Total volatility was 14.8% for stocks, 19.2% for gold and just 11.4% for SOLD. The latter has delivered superior risk-adjusted returns, with the lowest drawdowns.
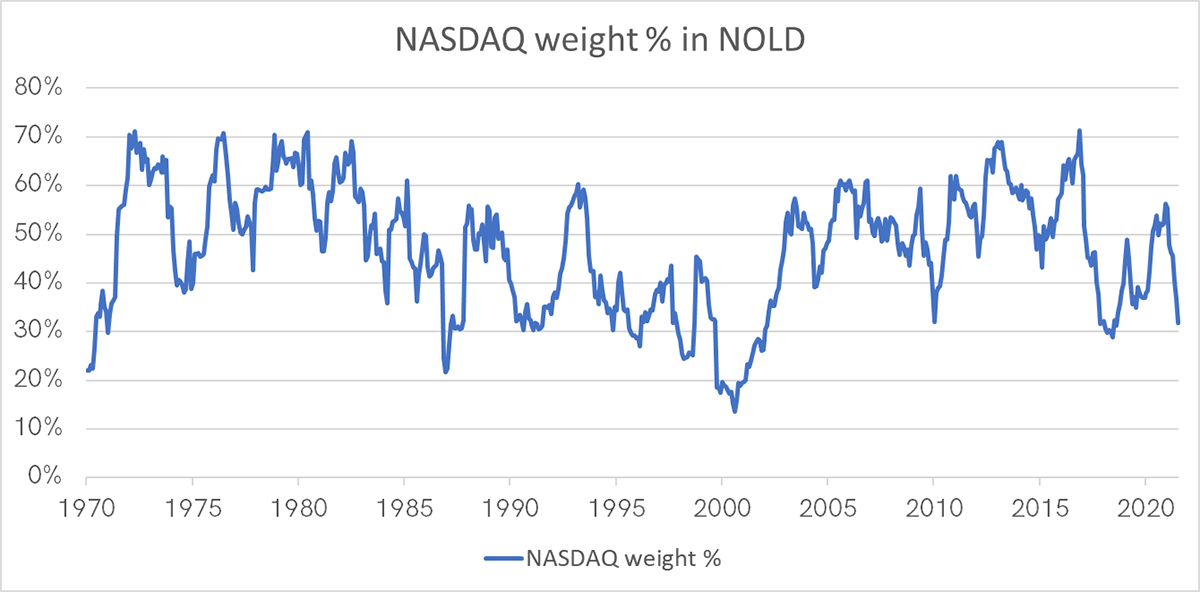
Next, I ran the numbers again using the NASDAQ Composite Index, which is not an unreasonable proxy for bitcoin over 50 years. The NASDAQ and gold become “NOLD”.
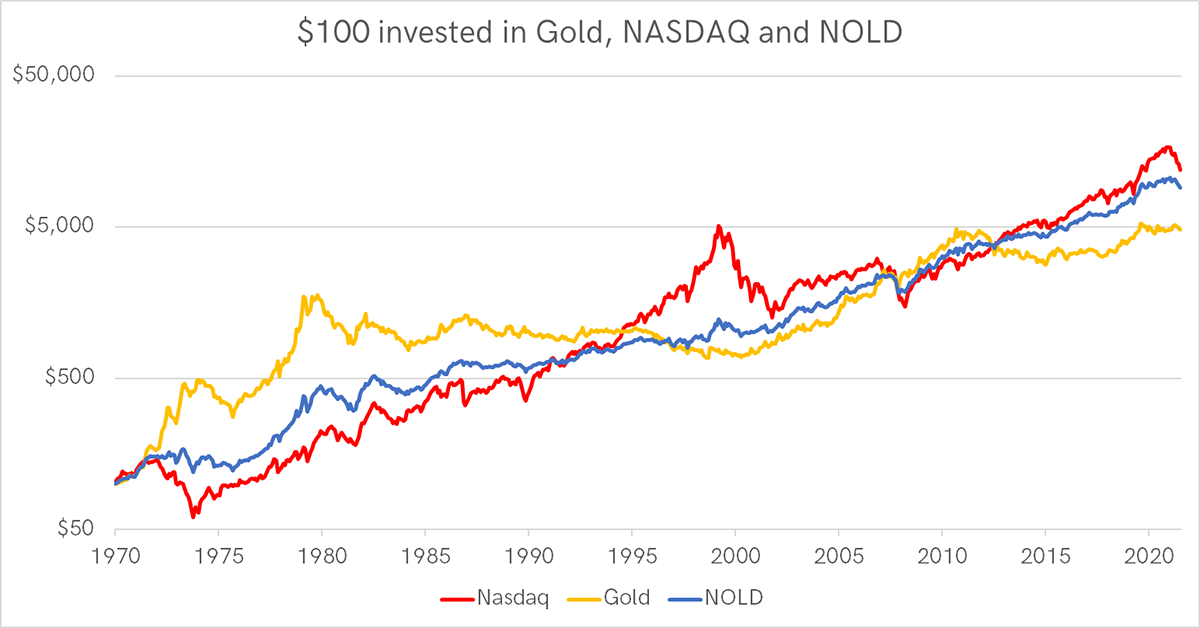
Source: Bloomberg, ByteTree
$100 invested in NASDAQ becomes $11,944, $4,827 in gold and $9,115 in NOLD, with volatilities of 20.2%, 19.2 and 12.8% respectively. The 2000 to 2002 NASDAQ bear market saw a peak to trough fall of 78%. NASDAQ’s volatility was quick to rise, and its weight in NOLD fell from 40% in 1999 to 19% in late 2000, troughing at 13% in 2001, before recovering. This is important as bear markets are generally associated with higher volatility, and by steering away from volatility, capital is protected. As shown in the charts above, both the SOLD and NOLD inverse volatility strategies achieved this.
Source: Bloomberg, ByteTree
Rebalancing a risky asset against gold on an inverse volatility basis adds value and leads to higher risk-adjusted returns with lower drawdowns. It is a powerful outcome.
In both SOLD and NOLD, the average allocation for each asset has revolved around 50%. In BOLD1, where bitcoin is much more volatile, the average is closer to 20/80 in favour of gold. This heightened volatility, and stronger inverse relationship, leads to greater alpha from rebalancing transactions.
The question was: “how likely is it that BOLD1 will make an absolute return?”
I say very likely because the inverse volatility weighting methodology is more focused on risk than return. The result is a capital preservation strategy as demonstrated, which is an effective way to deliver absolute returns.
BOLD1 will only fail if bitcoin fails. I do not believe it will, and so BOLD1 is an effective way for prudent investors to access a fast-growing asset. BOLD1 is a liquid alternative “portfolio” in its own right, with excess returns driven by rebalancing transactions.
How likely is it that BOLD1 will make a positive real return?
I believe that gold delivers a long-term expected real return of 0%. That is, it is an inflation hedge, and no more. My gold valuation model is based on this idea and can be seen in the slide pack.
In Roy Jalstram’s book “The Golden Constant”, published in 1977, he examined the gold price over time. He wrote:
“Gold has two interesting properties; it is cherished and it is indestructible. It is never cast away and it never diminished, except by outright loss. It can be melted down, but it never changes its chemistry or weight in the process. The ring worn today may contain particles mined in the time of the Pharaohs. In this sense it is also a constant… Its price has been remarkably similar for centuries at a time. Its purchasing power in the middle of the 20^th^ century was very nearly the same as in the midst of the 17^th^ century… it is easy to predict a more nearly free market for gold in the future, with the attendant possibility that gold will become a better hedge against inflation than it has proven over past centuries.”
The evidence from the past suggests gold has a long-term expected return of 0%, but Jalstram suggests it might be a little higher. With more wealth in the world looking for a hedge, that is plausible, but I do not need to make that claim.
The idea of gold being a constant, and therefore having a long-term expected return of 0%, is well documented. A long-term real gold price study by Dr Paul Kedrosky supports this, as do anecdotal studies by Dominic Frisby whereby a soldier’s wage in gold terms is approximately the same today as it was in Roman times. The late Julian Baring referred to the Savoy Dinners Ratio, which measured the price in gold sovereigns. More recently, the expert gold team at Incrementum follow the price of a pint of Guinness in gold terms, which I am sure they will measure for the next 1,000 years.
At times of high inflation or even financial meltdown, a 0% real return is attractive as the alternatives are negative, and sometimes significantly so.
As the 50-year studies in SOLD and NOLD demonstrate, adding a risky asset alongside gold on a risk-weighted basis improves risk-adjusted returns. If gold has an expected real return of 0%, then that of a risky asset and gold must be greater than 0% over a reasonable period of time. That is provided that the risky asset itself is on track to deliver real returns.
As I answered before, bitcoin is a growth asset, and so while that remains true, it will continue to deliver high returns, albeit with cyclicality and volatility. When bitcoin matures, its volatility will fall along with its growth rate.
Some believe that decades from now, bitcoin will calm down and start to develop risk-off characteristics as it behaves more like gold. While not my central thesis, this is possible, and if so, BOLD1 will continue to deliver a modest real return but by that time, bitcoin will be sufficiently stable to be held, in its own right, by cautious investors.
If bitcoin enjoys continued success, BOLD1 is an effective way to participate with less risk. Should bitcoin fail, BOLD1 would severely soften the blow.
BOLD1 is designed to enable investors to participate in a risky asset, with great potential, in a manner that would happily sit within an institutional investment environment. I believe it will deliver both absolute and relative returns over any reasonable timeframe. In addition, while inflation remains elevated, BOLD1 is very likely to deliver returns exceeding that of a traditional 60/40 portfolio.
If we were to return to a hard money environment, with sustained high real interest rates, the opposite would hold true, and I would expect a 60/40 to outperform BOLD1. That is unlikely to happen anytime soon.