Bitcoin Velocity Urges Caution

Disclaimer: Your capital is at risk. This is not investment advice.
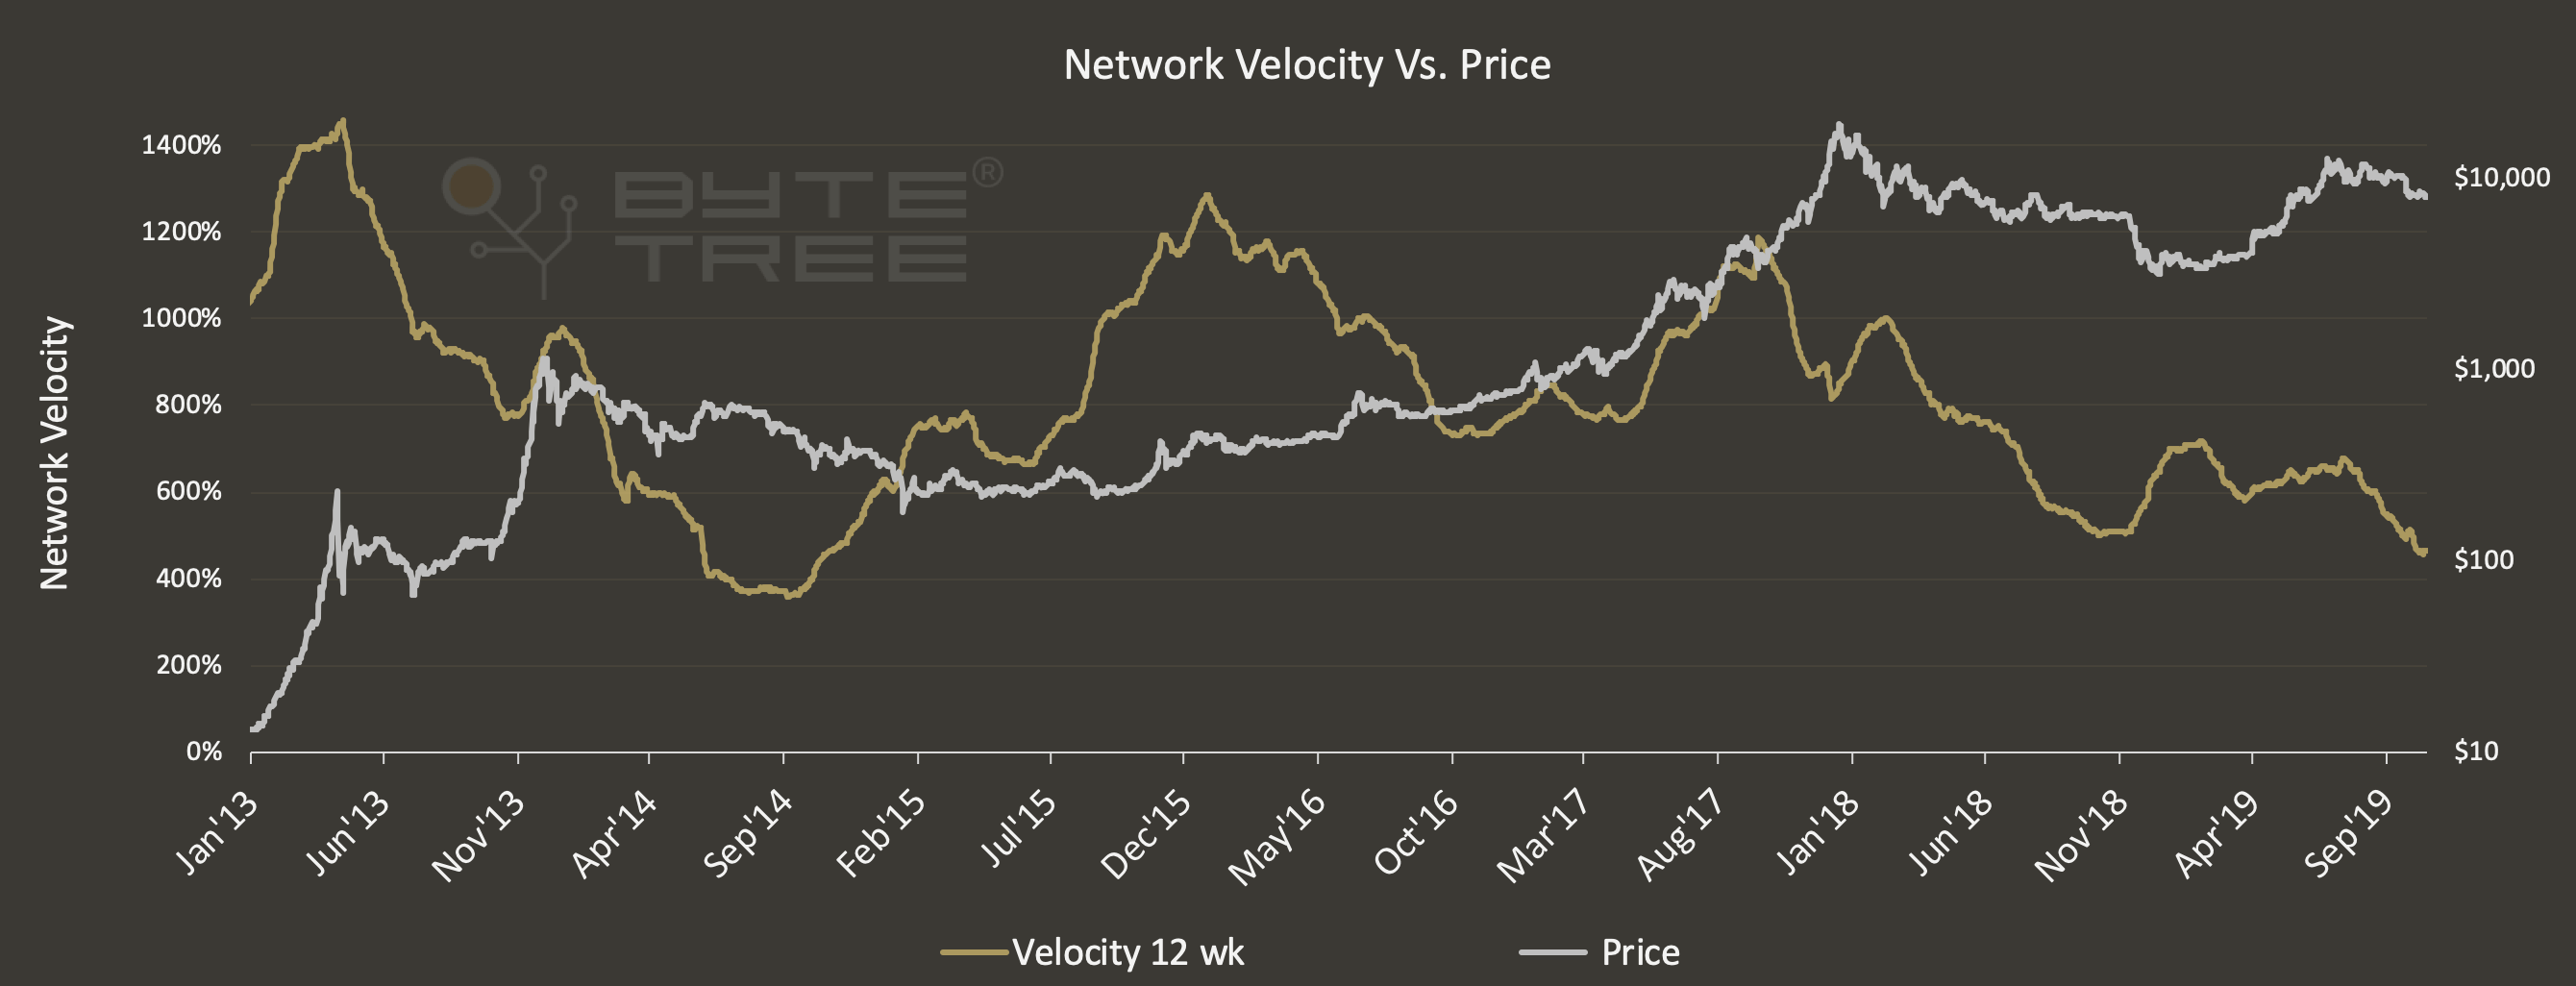
Bitcoin’s network velocity has been falling. This means that network activity has been slowing, which has historically been associated with price weakness.
Velocity shows you how quickly the coins are circulating within the network. When velocity is high, say 1000%, it means an average bitcoin is circulating 10 times per year. At 450%, it is circulating 4.5 times per year. This is an average network measure, and since many coins rarely move, others are circulating at a rapid rate. ByteTree 12-week velocity calculates the coins spent (transacted net of change) on a weekly basis, averaged over 12 weeks, and expressed on an annualised basis.

At first glance, it is hard to see how price and velocity relate to one another, as some of the strongest price moves have been associated with falling velocity. Yet consider that this is a non-price indicator and during those periods, large sums of money were changing hands, even if that means fewer coins at a higher price.
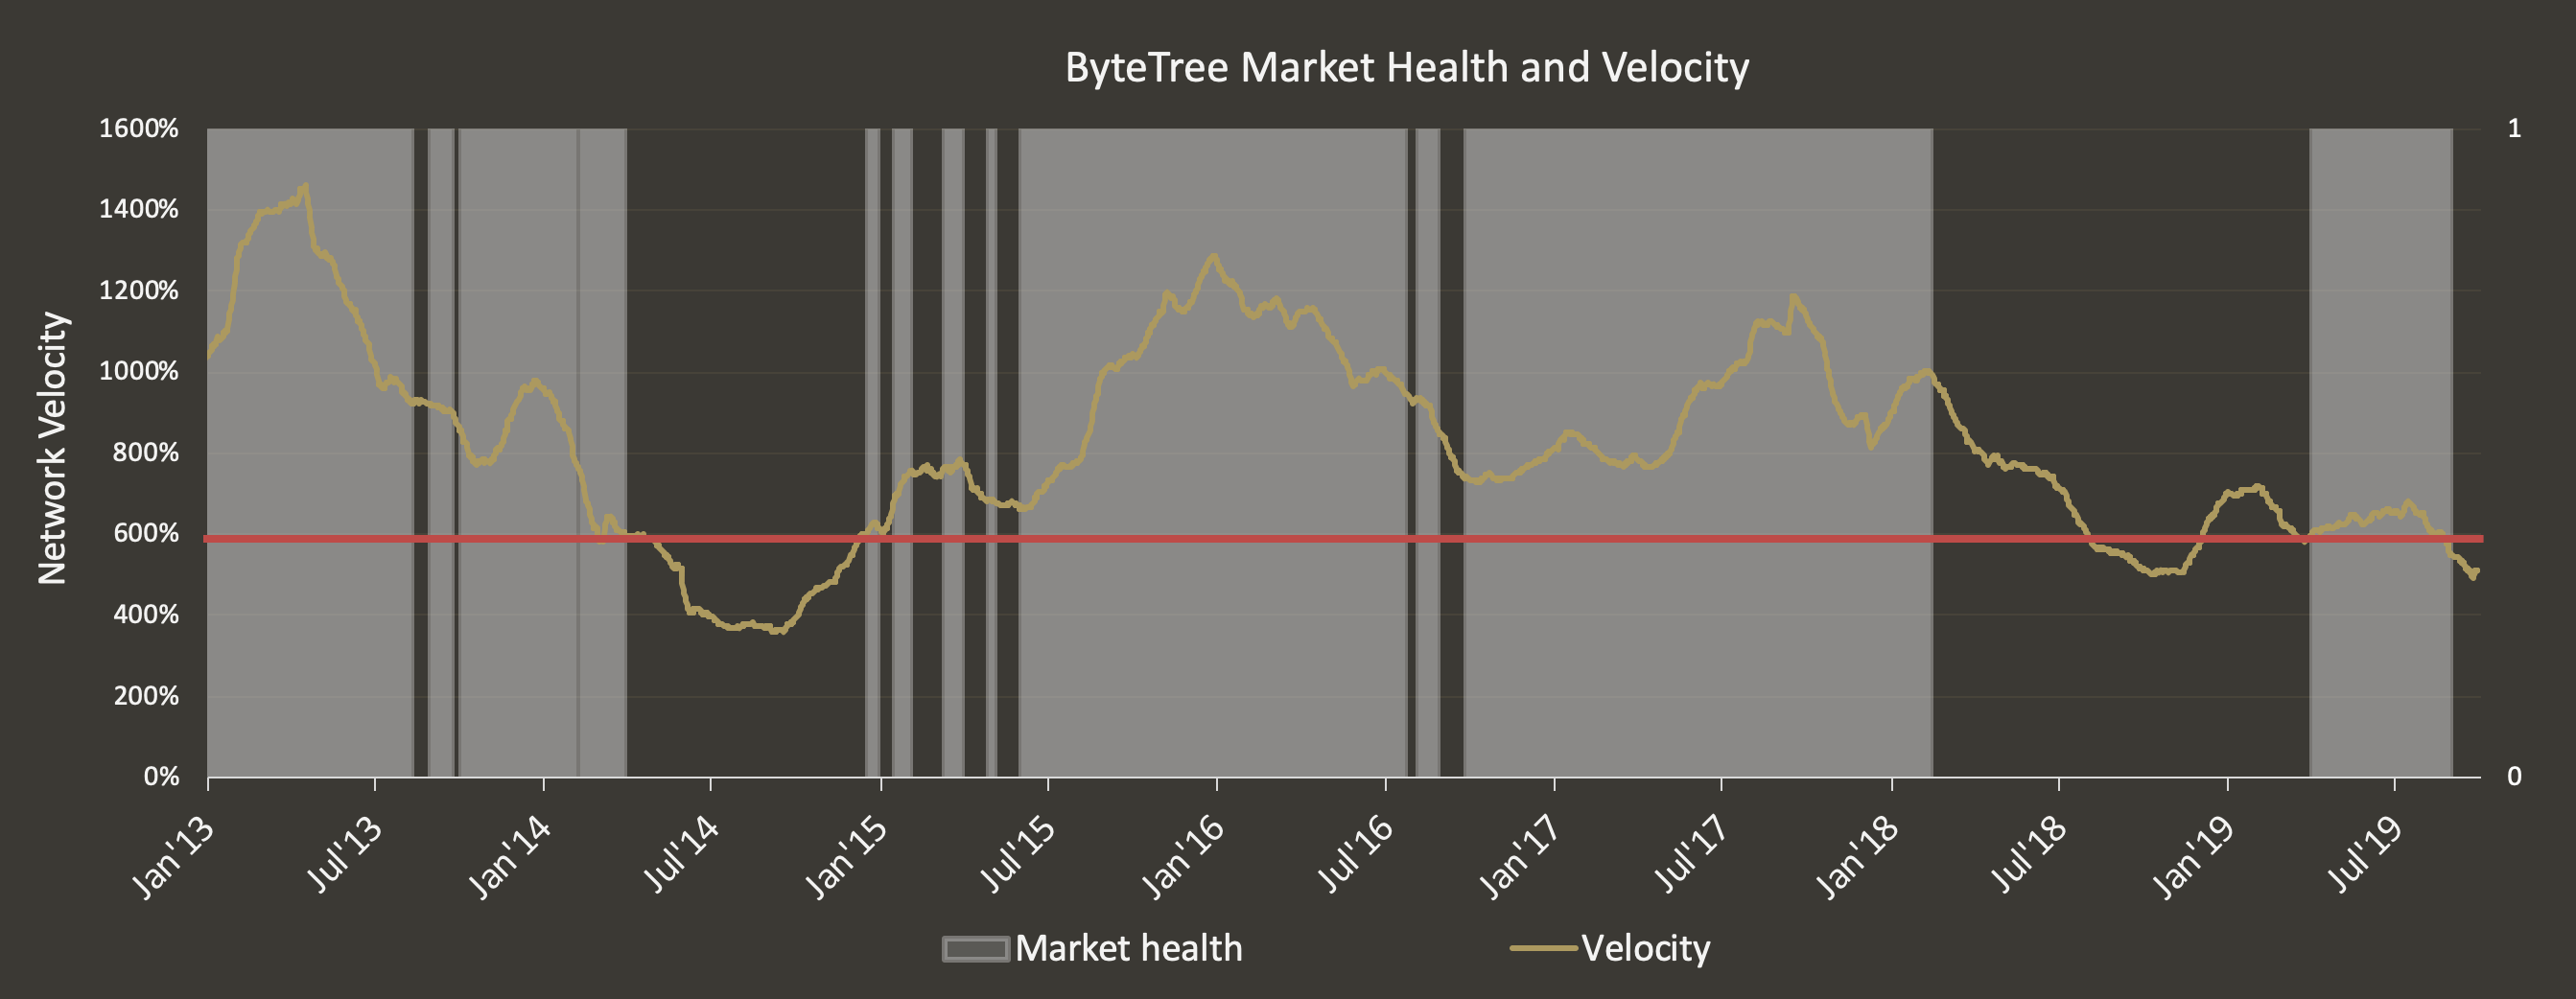
It isn’t so much the direction of velocity rather than the level. In the next chart, velocity is overlaid with network health. This makes things clearer. The dark areas were associated with low levels of velocity, mainly in 2014 and 2018. These periods saw price weakness.

The 600% line is the approximate historic danger level. The Bitcoin Network has seen this breached four times:
- 30th March 2014 at $460 - reversed on 12th December 2014 at $356
- 1st August 2018 at $7,480 - reversed on 4th December 2018 at $3,900
- 13th March 2019 at $3,852 - reversed on 2nd April 2019 at $4,802
- 20th August 2019 at $10,708
The first and second signals were effective and correctly warned of trouble ahead. The reversal buy signals were lower than the previous sell signals, and in both cases, the maximum drawdown was over 50%. The third signal was less effective as it soon reversed. It also fell to 583% which is low but much higher than the other occasions. The latest reading of 463% has not been seen since late 2014. It is a loud and clear message that the Bitcoin Network velocity is weak. This may imply that a period of further price weakness lies ahead. But that is not a certainty, as it could turn up at any time. The sooner the better.
You can follow network velocity on ByteTree. The 12-week measure gives a good balance between stability and timeliness. It is updated every block.

Comments ()