Miner's Rolling Inventory (MRI)

Disclaimer: Your capital is at risk. This is not investment advice.
ByteTree Indicator for Miner Inventory Behaviour
MRI measures the changing bitcoin inventory levels held by the miners. An MRI above 100% means miners are selling more than they mine and running down inventory. Conversely an MRI below 100% means the miners are hoarding bitcoins.
`(Delta "Bitcoin 1st spend " n_"weeks") / (Delta "Bitcoin generated " n_"weeks") xx 100`
ByteTree recommends n should range between 3 and 6 weeks
Example
Over a six-week period, the miners generated (mined) 76,963 new bitcoins while first spend saw 78,342 bitcoins join the network. Therefore 2% more bitcoins have been “spent” than have been mined. ByteTree would describe this as Bitcoin’s six-week MRI is running at 102%.
Unspent inventory and first spend explained
When a miner solves a block, they receive the block reward plus fees. These are newly minted bitcoins that have never been spent (transacted). Before they are spent, they show up on ByteTree as unspent inventory, which we shorten to inventory. When they are first spent, they show up as first spend. And each subsequent time they are spent in the future, they become general spend or transaction value.
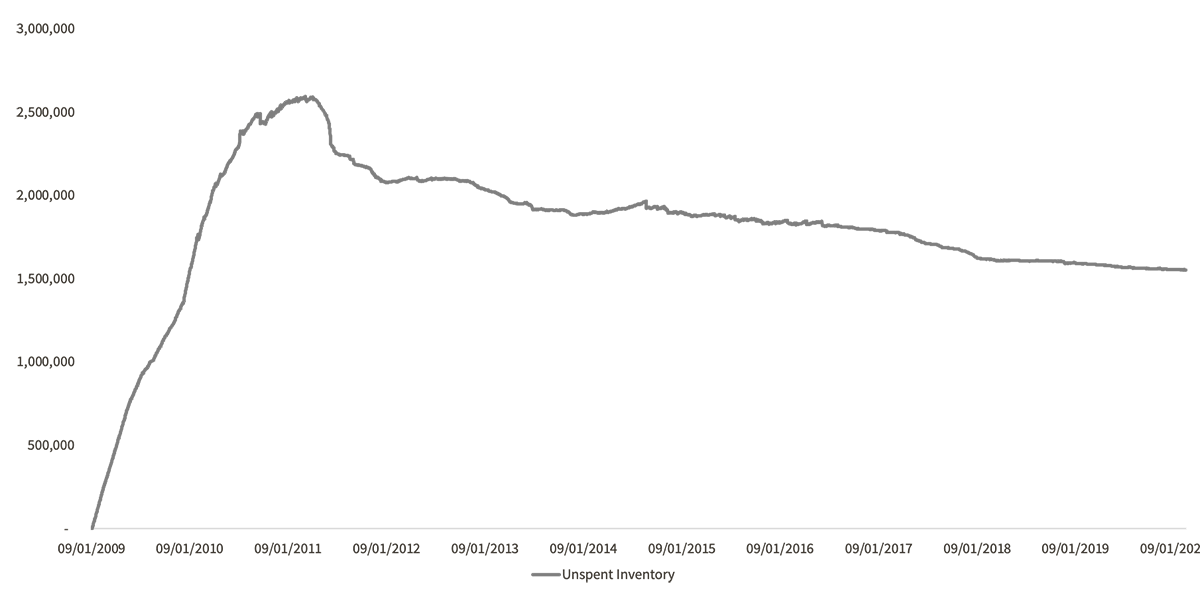
As of early 2020, bitcoin has inventory of around 1.5 million coins, which were mined in 2009 and early 2010. The vast majority of the 16.6 million coins mined since then have been distributed into the network.
Bitcoin unspent inventory

Inventory peaked on 13 March 2011 with 2,593,051 bitcoins. It had been rising rapidly from 2009 and 2010 because it was easy to mine bitcoins and there wasn’t much to do with them at the time. But as application and interest grew, so did demand for bitcoin. The miners then sold those bitcoins to new buyers and had to transfer them across the blockchain in the process, which meant they were now spent. Inventory has fallen by just over 1 million bitcoins since the peak nine years ago. Given that 12.5 million bitcoins have been mined since the 2011 inventory peak, 13.5 million new bitcoins have joined the network since that time.
Investment implications
MRI has been tested for its impact on price. The natural assumption might associate a high MRI (heavy miner selling) with downward pressure on price. Many might also assume that a low MRI would be positive for the price. Remarkable as it may seem, ByteTree’s research has found the opposite to be true. It turns out that a high MRI doesn’t put pressure on the price, it is reflective of a strong market bid that the miners are comfortable to sell into. And when that bid fades, the miners hold back, MRI falls and inventories rise.
When you come to think about it, this is logical. A crypto currency with low demand, would have a thin market to sell into. As a result, the MRI would be low and inventory would keep rising. In crypto, value creation comes from building a vibrant and widely distributed network. If the, majority of the coins are held by the miners, then there is no value creation as there is no network.
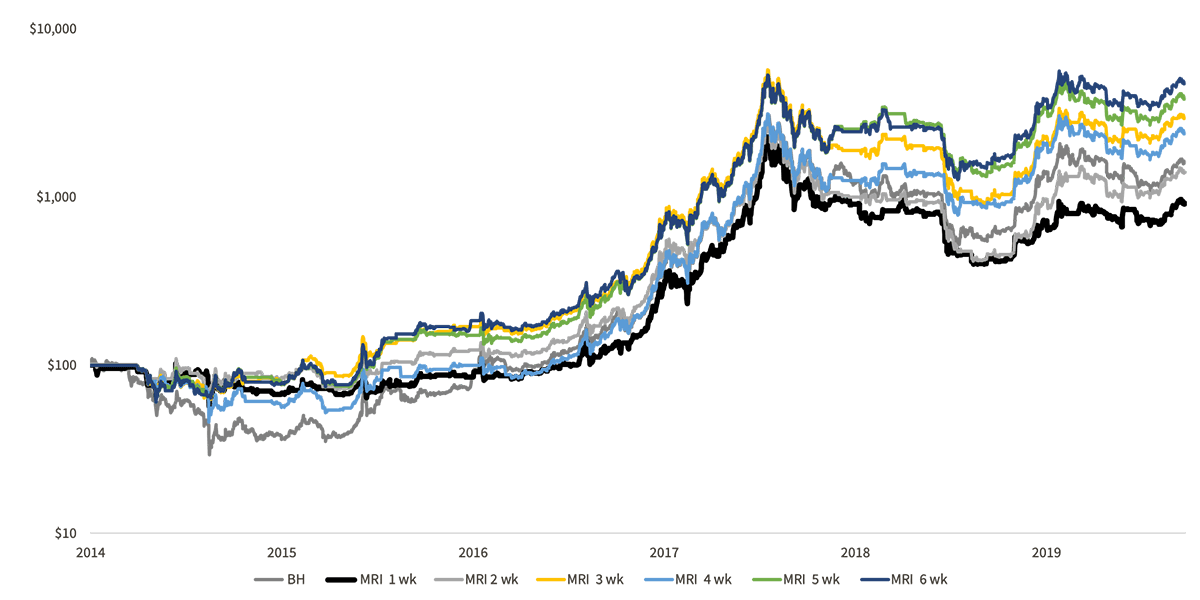
The tests demonstrate this. The first chart shows a strategy that owns bitcoin if the MRI is greater than 100% and compares it to buy and hold. The results for one week MRI is unimpressive. Two week MRI is similar to buy and hold, while three weeks and above show improved returns with lower drawdowns. The reason for this is that higher MRI readings were seen more frequently in bull markets than in bear markets.

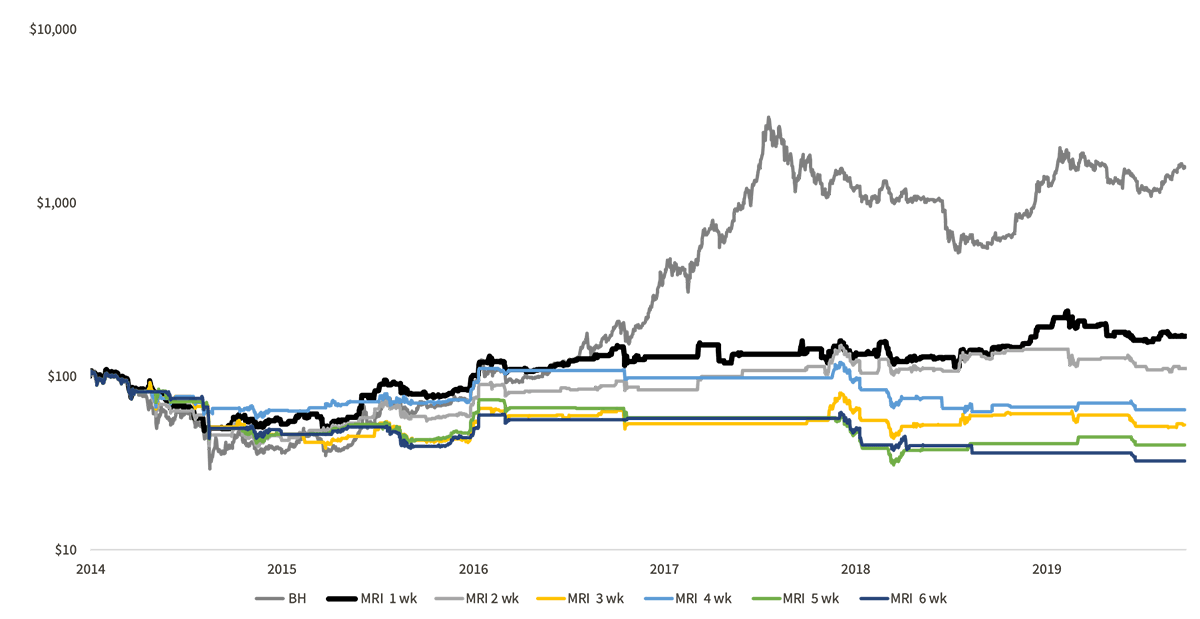
In order to confirm this thesis, we next examine the opposite condition. This chart shows a strategy that owns bitcoin when the MRI is less than 100%. The results are poor, and in most cases, the strategies lose money despite bitcoin rising 16 fold over the period. This gives us confidence that MRI is an effective risk management strategy as price weakness is associated with a low MRI.

Summary
Blockchain data gives valuable insights. In the case of MRI, it is telling us about the state of the market bid. The miners are savvy market participants, who have invested time and money into their operations. It stands to reason that they want to achieve good prices to maximise profits. Regardless of their market views, they have costs that need to be met, and so they are continuous sellers. However, they do not want to damage the market, and so hold back when it is weak. And when it is strong, they run down their inventory.
MRI is a useful market health tool. If the reading is low, then it makes sense to be cautious. And if you are a short seller, then a low MRI is your friend. A high MRI signal won’t necessarily lead to immediate riches, but as a process to follow, it is something we should embrace and associate with bull markets.
On the ByteTree.com terminal, visit “On-Chain”. If 5 week first spend is greater than generation, then all is well. If it isn’t, then move with caution.

Comments ()