Fees Indicate Growing Network Demand

Disclaimer: Your capital is at risk. This is not investment advice.
Monitoring the Bitcoin Economy
Fees are paid to miners to facilitate transactions in the Bitcoin Network. Technically, these are voluntary, but most people include a fee to motivate the miners to process their transaction as soon as possible. Fees tend to be a fixed amount regardless of the transaction size, which makes large value transfers cheap, and micropayments relatively more expensive.
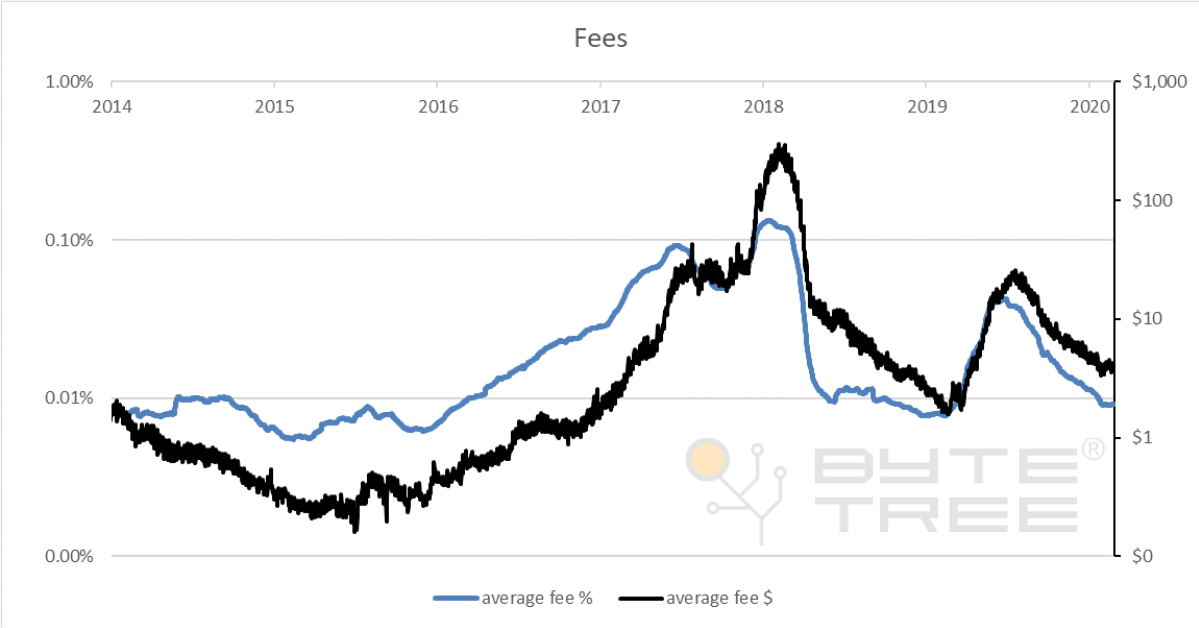
Fees have dropped below 0.01% when the market has been slack, and been ten times higher at 0.1% when the market has been strong. In cash terms, fees have ranged between 10 cents and over $100. This is a significant range.
Example
In 2014 and 2015, fees remained low. The average transaction struggled to break above a dollar which was 0.01% of transaction value. Low fees imply there was plenty of slack in the market and the bull market didn’t get going until it tightened. Rising fees reflects rising network activity; something we would associate with bull markets.
Rising fees then followed price until the market peak in late 2017, only to fall quickly during the subsequent bear market in 2018. The bottom line is that fees are highly correlated with price.
Fees Explained
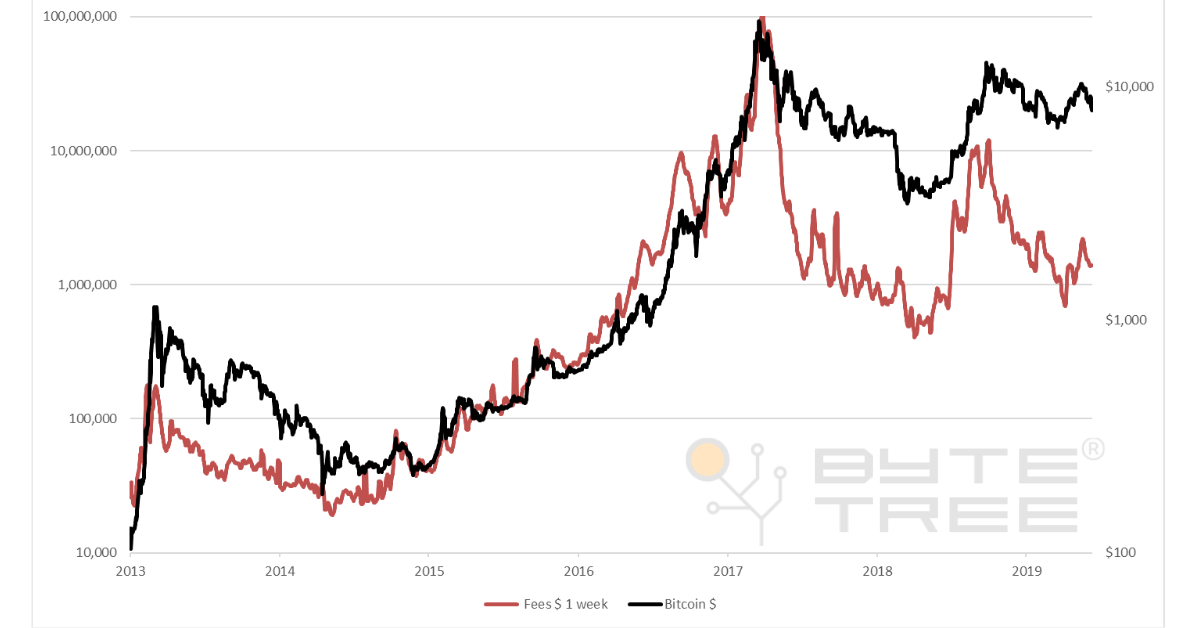
The level of fees reflects the level of economic activity within the bitcoin network. ByteTree data enables fee trends to be measured over different periods of time. This chart shows total fees over a rolling week. It is important to use weeks rather than days due to the weekday bias. One-week fees are volatile.
Bitcoin and Weekly Fees
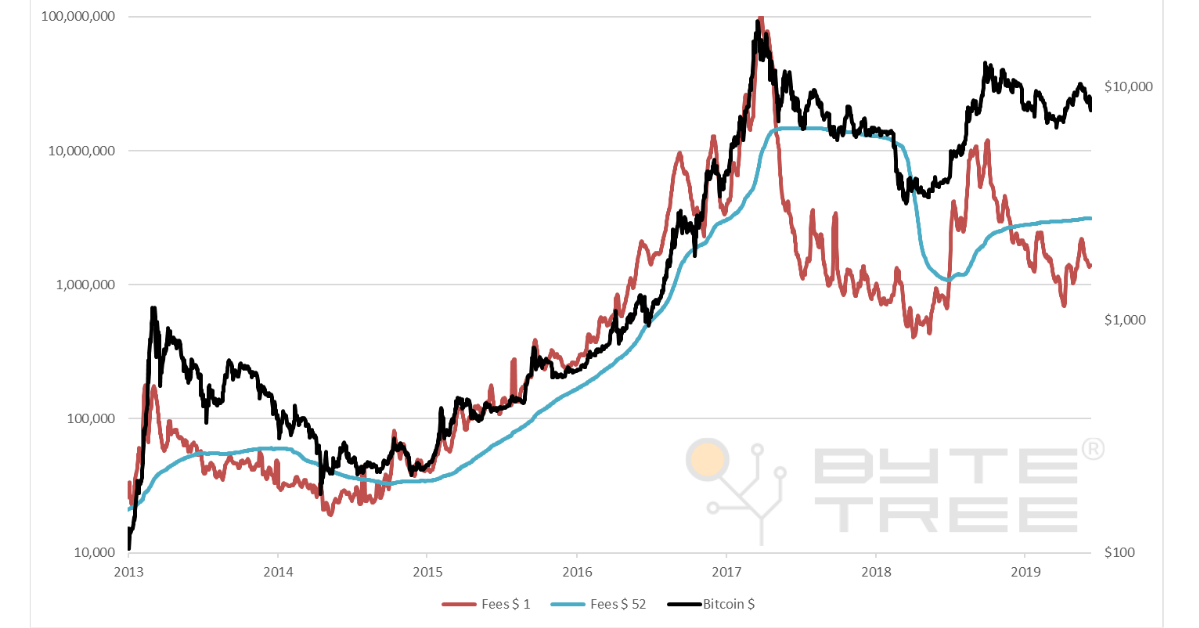
Bitcoin and Long and Short-Term Fee Crossovers
A longer term measure can be added, in this case, 52 weeks, which is smooth. When 1 week fees rise above 52 week fees, that has been predictive of a bull market and vice versa.
Investment Implications
The key question for investors is whether this is predictive of future price trends. Backtesting these time series show that a strategy that invested when 1 week fees were greater than 52 week fees had the following result.
Bitcoin Fee Crossover Backtest
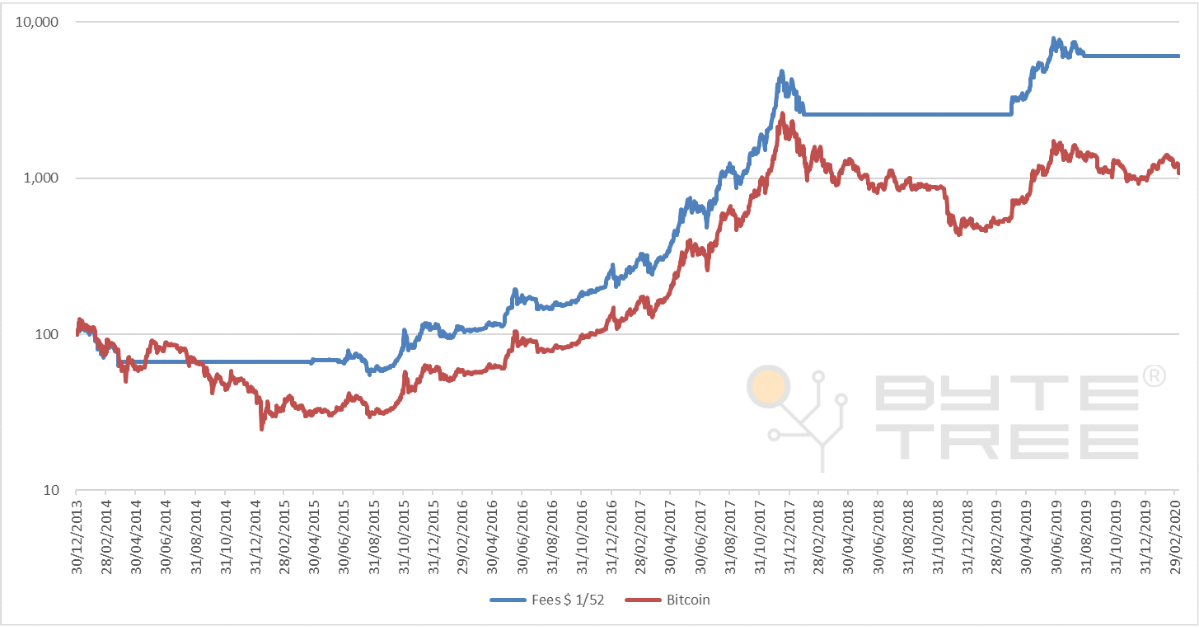
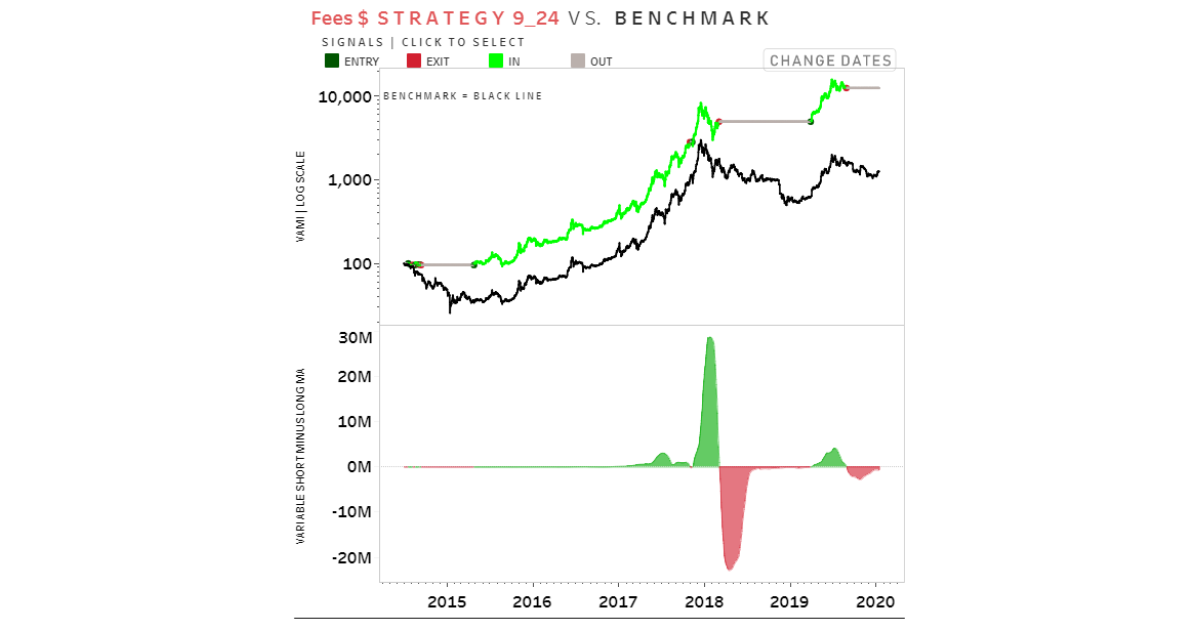
It is an impressive outcome. The fee strategy sat out of the market in 2014, 2018 and late 2019. These were all times that the Bitcoin Network was contracting, and the price showed signs of weakness.
The ByteTree Backtest
The ByteTree data team have backtested all time combinations of a number of indicators, including fees. All time combinations have made money in absolute terms because Bitcoin has done exceedingly well over time. The table below shows returns relative to Bitcoin. Red implies a performance lag whereas green shows excess returns.
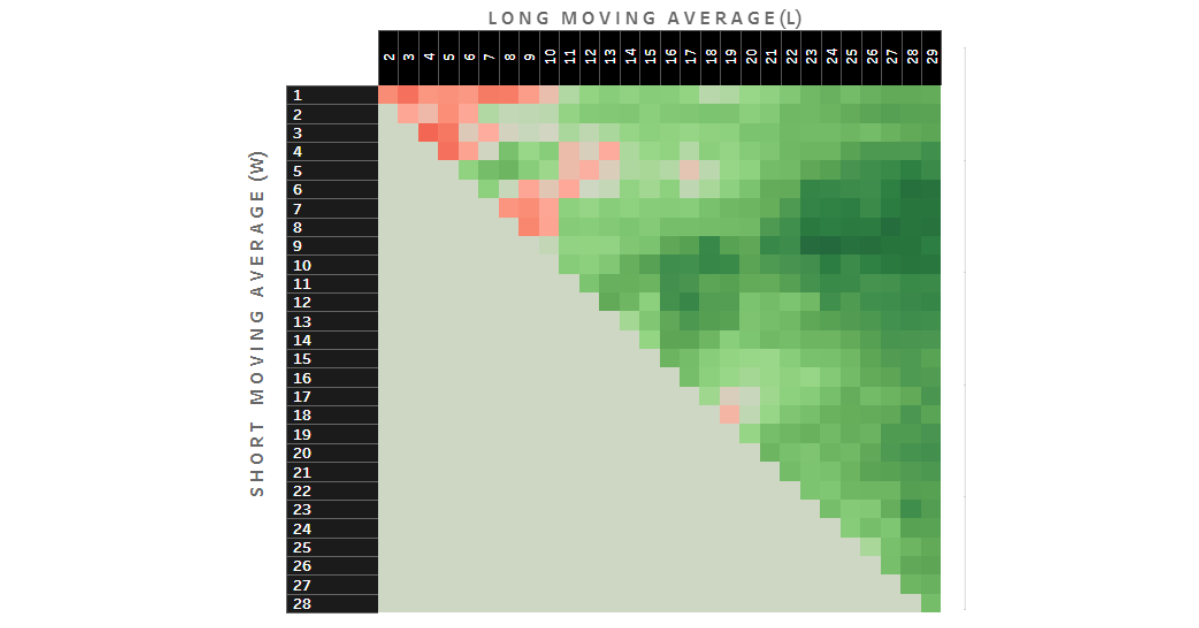
Ultra short-term performance has mixed results. However, when the time horizons are increased, the results improve dramatically. With a short term trend of 6 to 10 weeks, and a long term trend above 20 weeks, the results become strong.
Using this data, ByteTree discovered that the 9 and 24 week combination have historically delivered the highest returns. The excess return has solely been generated by sitting in cash during bear markets. This strategy has no ability to outperform during bull markets, as it merely owns bitcoin without leverage.
Summary
Bitcoin is a high growth asset, that is expected to generate significant returns in the future (although perhaps not as much as the past). The ByteTree approach considers risk management to be the most important consideration. When times are good, stay ling. Yet when the risk increases, it is better to sit on the side-lines.

Comments ()