A 30-billion-dollar Week for Bitcoin as On-Chain Volume Grows 120% Since June

Disclaimer: Your capital is at risk. This is not investment advice.
ByteTree Market Health Update; Issue 37
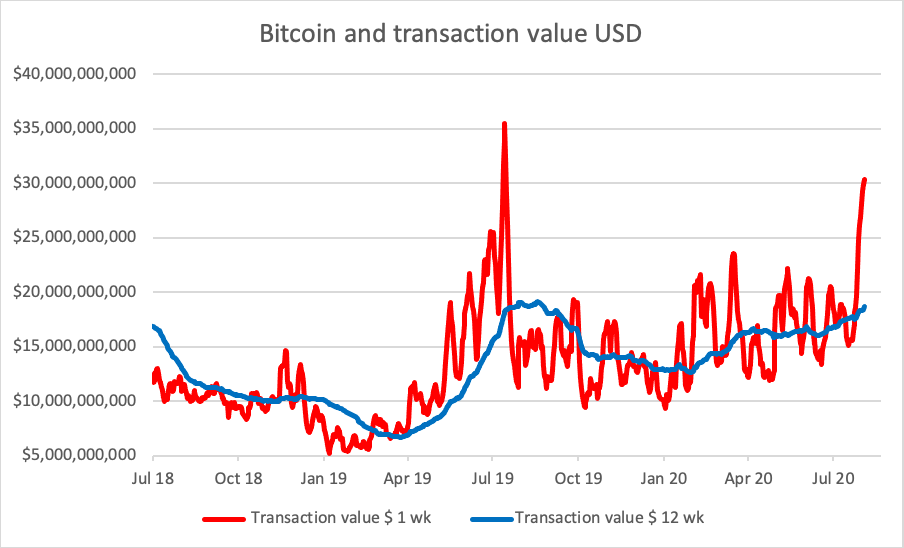
You know things are going well when you have to change the y-axis on your chart. In June 2020, transaction value saw just $13bn of weekly transaction value. That has grown to $30bn last week; a 122% rise. Back in July 2019, transaction value briefly touched $35bn but that soon came back to earth with a thud.

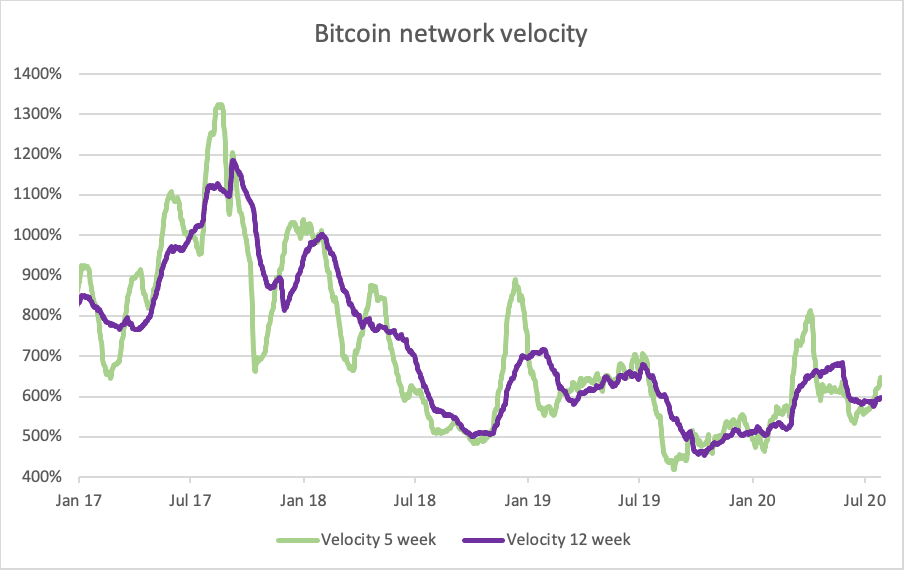
ByteTree transaction value records the price at the time of each block and so it lags sharp price moves. One criticism is that higher prices lead to higher transaction value. That’s only true if network velocity remains constant. In the flaky rallies, velocity tends to fall, as fewer Bitcoins are needed to exchange the same amount of dollar value. In the stronger rallies, velocity remains stable, and in the best rallies, velocity rises with price.
That is happening now.

12-week velocity remains marginally below 600%, but it is rising. 5-week velocity is rising sharply, and that’s happening in a bull market. When it last spiked in March, that coincided with a price crash as more coins were required to exchange the same amount of dollar value. That was a healthy signal in the sense that the network wasn’t dying but adjusting. Had the price collapsed in March, coincided with falling velocity, the network would be imploding. Now, we have price, transaction value, and velocity rising together, which is bullish. Very bullish.
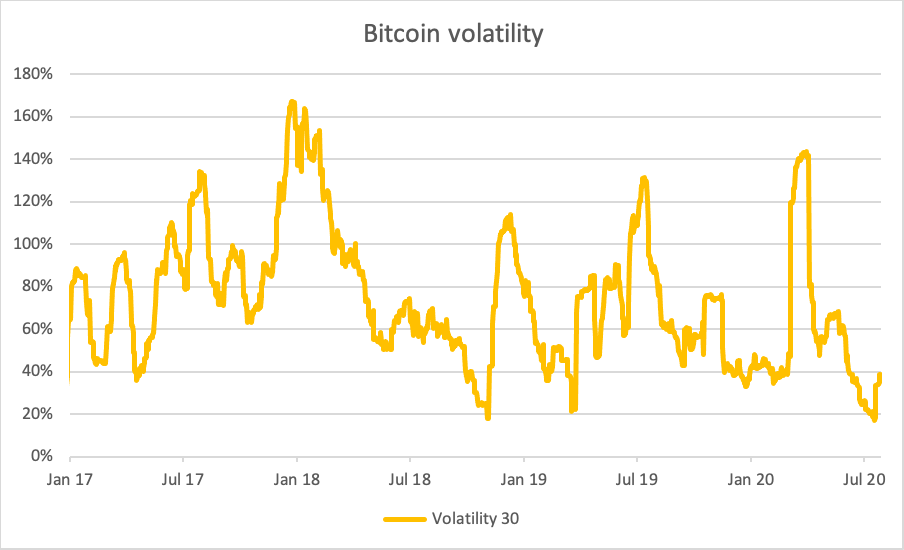
I would add that volatility is important too. I have recently highlighted the power of low volatility breakouts. That tells you the market is calm and is resting in equilibrium ahead of a strong move whether up or down. When the breakout comes, it kicks off a lasting trend. Since the network has been growing, this latest breakout has given birth to a new bull market.

Last summer, the brief price spike to $13k was accompanied by a volatility spike to over 100%. Among other things, high volatility reflects high levels of speculation. Today, volatility is still below 40%; a condition seen only 20% of the time since 2011. A rising price on low volatility is also bullish.
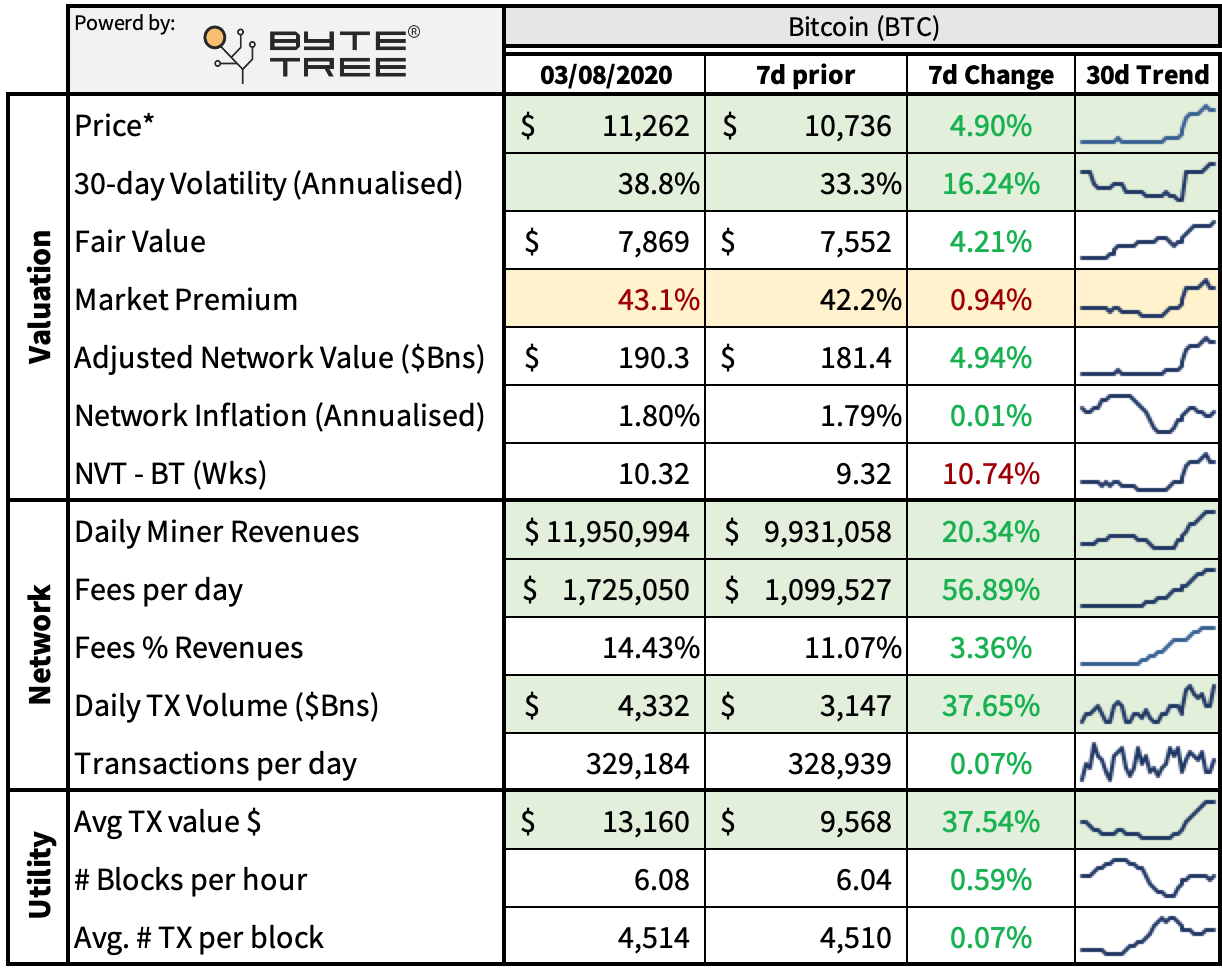
Once again, last June saw a 107% premium above fair value using ByteTree data. Today that is 50%. We use the 12-week average transaction value and have a fair value of $7,866. The 12-week average means it lags price, but the advantage is that it is a stable metric; something that is essential in valuation models. The key point is that fair value is rising because the transaction value is rising. If $30bn of weekly transaction value holds, then ByteTee will soon be showing Bitcoin fair value close to $12k, which would be a 7% discount, rather than a 50% premium.
Finally, on the technicals; last July Bitcoin traded 45% above its 30-day moving average, whereas today, that is just 16%. Bitcoin is a long way from being overcooked.
Network Demand Health Model

The latest score remains at 5 out of 6. As mentioned, the only metric on the slow side is velocity, which sits just below 600%. Ideally, this will rise above 625% to get a score in full health. But a network demand health score above 4 statistically calls for a bull market, and so 5 is good news.
Miners’ rolling inventory (MRI) is also bullish as the miners are selling onto strength. If the miners were the only sellers in the network, their selling would concern us. But they extract around $70m per week from $30bn of transaction value. Halving makes their selling pressure increasingly less relevant in influencing the Bitcoin price. We track them because they are savvy and sell into strength. A high MRI reflects a healthy market bid for them to sell in to.
Summary
The network effect benefits from more people, transactions, applications, and liquidity. Bitcoin is a demand story driven by the network effect. That network is growing. Speculative activity remains muted as the price is far from overbought, and the volatility is low. Bitcoin is in rude health and this bull market has legs.

Comments ()