Bitcoin + Gold = BOLD

Disclaimer: Your capital is at risk. This is not investment advice.
ByteTree Market Health Update; Issue 63
Tesla announced that they had invested $1.5bn in bitcoin and the price duly surged. Markets are more efficient than many believe, and in recent months, the bitcoin price has responded positively to known investment flows more than anything else. Back in the day, Bitcoin would spike on news that a coffee shop accepted payment in Bitcoin, or a minor celebrity liked a tweet.
At the time, that made total sense because it was evidence of network adoption and that Bitcoin was catching on. Other examples showed price correlating with the number of addresses, wallets and transactions. Those days are behind us, and today it’s all about the money.
In 2021, Bitcoin miners will be rewarded with approximately 363,350 BTC, which they will presumably sell most because that is their business. In the fourth epoch (4th halving period post-May 2020), it is easier to sustain higher Bitcoin prices than in previous times as the selling pressure has fallen considerably. That is why future epochs are bullish.
However, to sustain a $50,000 BTC price, that requires $18.17bn of investment flows, each year until 2024. After that, this falls to $8.7bn (coin generation and fee estimate) in the 5th epoch. It keeps on falling thereafter, meaning that high prices are easier to sustain in the future, than today.
To put the current run-rate of $18.7bn of annual flows into context, the gold ETFs attracted $41bn last year, in their best year on record as 23.84 million ounces were scooped up at an average price of $1,722 each. The late 2020 weakness in the gold price came about as investors banked profits and headed for the exit in November. Given the offsetting flows into Bitcoin at the time, the evidence points towards gold investors switching into Bitcoin.
It has been a good call as the gold investors made it in time for the Bitcoin surge. If bitcoin can attract $41bn in 2021, as gold did last year, expect to see an average bitcoin price of $100k. This is why it is totally rational for the price of bitcoin to bounce to news of inward flows.
A million-dollar Bitcoin
I believe there will be a million-dollar bitcoin price; you just need to be patient. $41bn of inflows will easily see a million-dollar-bitcoin, but not until 2044. Add in 2.5% average consumer price inflation and that lands in 2036. Bolster inflation to 5%, which seems more likely than not, and that brings it forward to 2032.
2032 is still 11 years away, but a move from today’s price is a huge opportunity with an IRR of 32%. With bonds yielding zero and so on, you can understand the attraction. To sustain a million-dollar Bitcoin in the 4th epoch, or even the 5th, would require huge sums of money. Better to be patient, conserve capital and let nature take its course.
This is bitcoin, so anything is possible, but consider that bitcoin will not always be fed by gold outflows. There will be times when they move the other way. On the great journey to 2032, I suspect these flows will move back and forth several times. Don’t forget, that a 5% inflation rate would also likely see gold break $10,000 per ounce. It’s a much lower return, but not one to ignore.
One advantage that gold has is that the miners get paid in a very different way. You just pay them once for their hard work, and they never ask for anything again. This model has worked for thousands of years and the miners haven’t complained once.
The comparison between bitcoin and gold is fascinating. Gold is nice to look at, and has remarkable physical properties, but is static, while bitcoins are dynamic. Gold is expert at sitting still, while bitcoins are buzzing with electrons. Having followed gold for 22 years, and Bitcoin for eight, I believe in a balanced approach between these great assets.
Bitcoin + Gold = BOLD
Combining bitcoin and gold is a good solution. Both assets are long-term stores of value, yet they both have their strengths and weaknesses. One is volatile, the other is calm. One is modern; the other ancient. One requires energy; the other does not. One has utility while the other has little outside of jewellery. Above all, one is an established monetary asset accepted all over the world, whereas the other hopes to catch up.
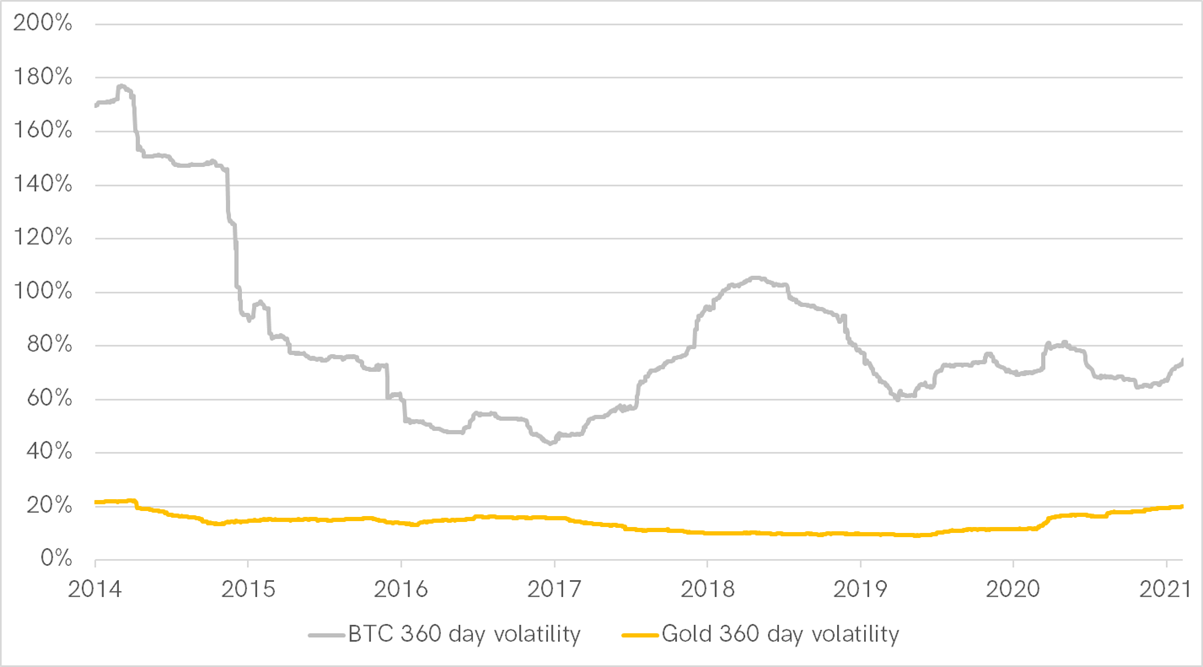
While both have their pros and cons, the BOLD combination exceeds all expectations. There are many different potential BOLD weighting methodologies. Our preferred technique is to focus on volatility. It has been tried and tested in other asset classes, with great success, and is simple to implement. Using 360 days as our preferred volatility measure, gold and bitcoin can be compared.
Gold and Bitcoin volatility

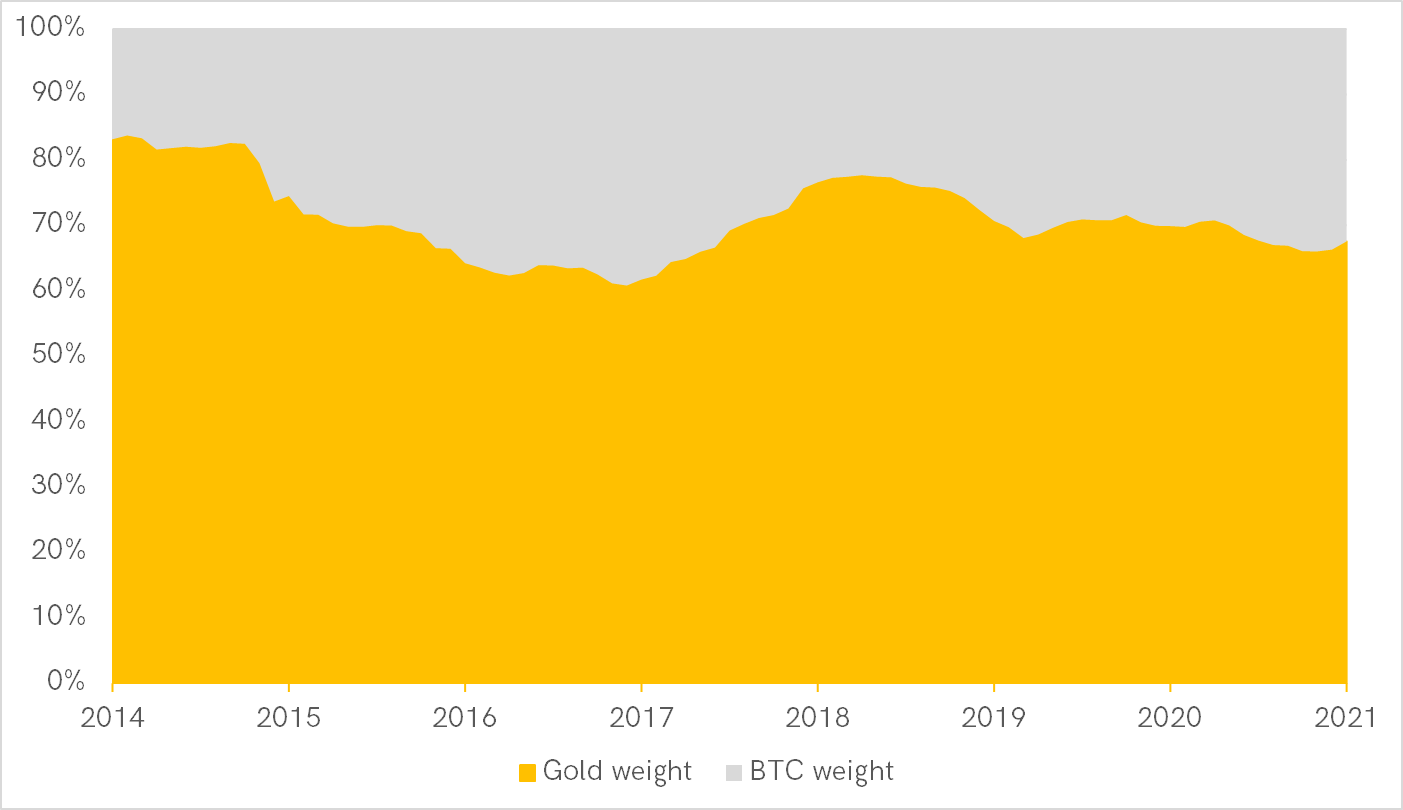
Gold has seen volatility consistently below 20%, whereas Bitcoin has rarely dipped below 60%. Sparing you the details, the less volatile asset gets a higher exposure and vice-versa, which is then rebalanced each month. Since 2014, this would have seen an average gold exposure of 70%, and Bitcoin, 30%. The range has seen Bitcoin exposure peak at 40% and trough at 20%, with gold picking up the balance.
BOLD asset allocation since 2014

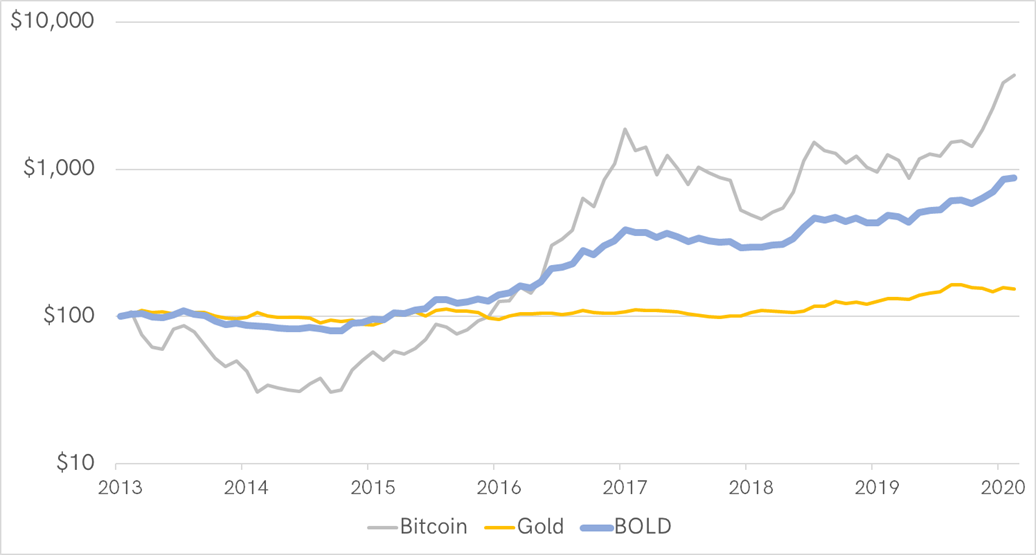
Having more Bitcoin exposure when it has been relatively calm, such as 2016/17 or 2019/2020, has paid dividends. Having less during the bear markets in 2014 and 2018, successfully reduced risk when it mattered. Bitcoin has performed best, while BOLD sits neatly in between.
BOLD delivers the best of both worlds

Higher rates of compounding are achieved by reducing drawdowns. The maximum drawdown for BOLD has been a tolerable 26.6%, which is not far below gold itself. BOLD volatility comes out at a highly respectable 26.7%, which is broadly in line with a company such as Microsoft. The Sharpe ratio, a simple measure of risk-adjusted returns, was 1.34, which is remarkable.
| Bitcoin | Gold | BOLD | |
|---|---|---|---|
| IRR | 70.4% | 6.3% | 35.8% |
| Volatility | 82.4% | 14.0% | 26.7% |
| Sharpe | 0.85 | 0.45 | 1.34 |
| Max DD | -75.7% | -20.1% | -26.6% |
Source: Bloomberg; ByteTree. Bitcoin, gold and BOLD simulated returns, 360-day volatility, Sharpe ration and maximum drawdown 1/1/2014 to 31/1/2021.
The BOLD strategy works because gold and Bitcoin behave in different ways, despite being monetary assets. Both will spend time in and out of favour, and investment flows will shift between them accordingly. If you believe inflation is a risk, then simply own BOLD as it naturally diversifies between the two assets in a simple, scalable, and logical manner.
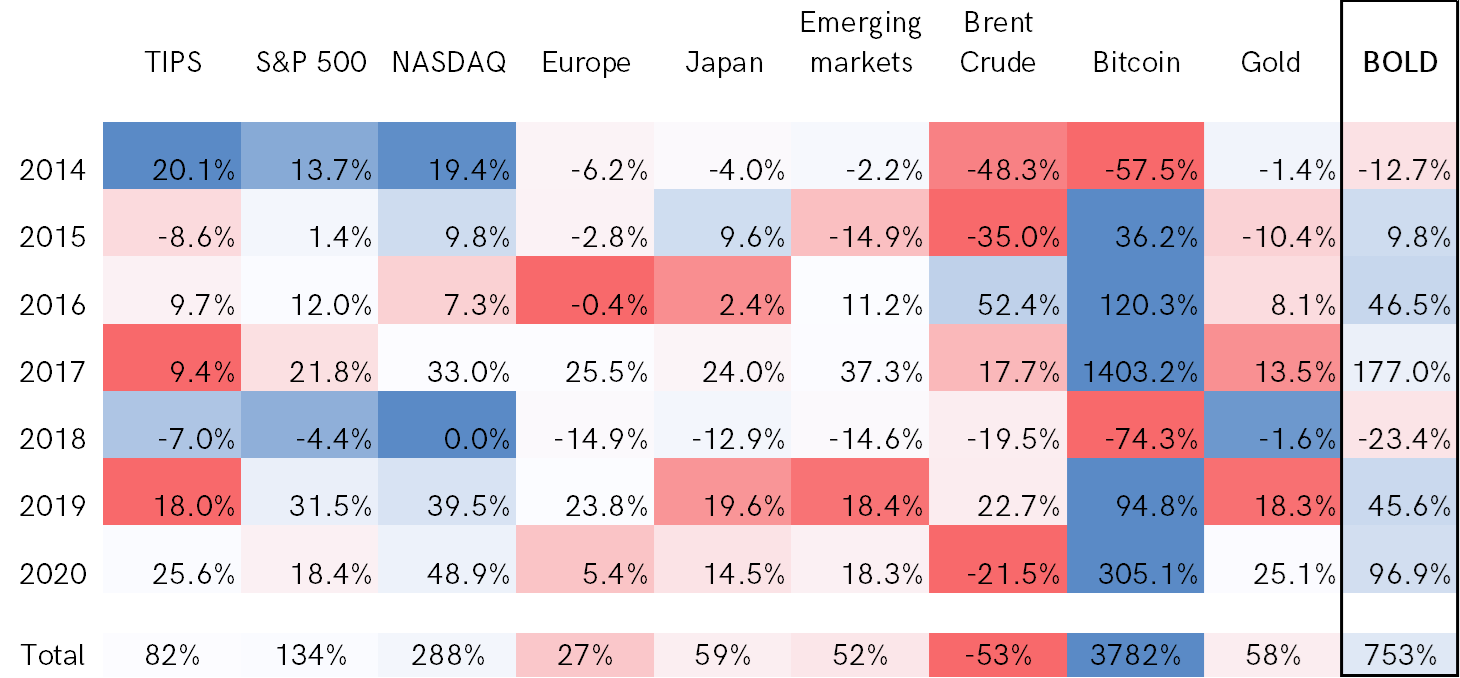
Comparing Bitcoin, gold and BOLD to traditional asset classes. BOLD has never been the best, nor ever been the worst, which makes it attractive in the eyes of asset allocators. BOLD’s worst year was 2018, when it wasn’t much behind European equities, emerging markets or oil. In most years, it has delivered a resounding result, and I would expect it to continue to do so, for as long as the risk of inflation persists.
Asset class returns by year

In an inflationary environment, the Bitcoin versus gold conversation has come to the fore. Even Michael Saylor, honorary Bitcoin head of sales, supports institutions to allow both asset classes to be held on their balance sheets. We believe this makes sense because volatility matters, as a profit or loss must be recognised in a company’s financial statements.
BOLD jumps off the page as the asset for the next decade. It spices up gold, while de-risking Bitcoin. This is why ByteTree.com and ByteTree Asset Management have decided to specialise in this field. Over the coming weeks, expect to see some new features on our website that will help to prepare us for this BOLD new world.

Comments ()