Week 38 2021
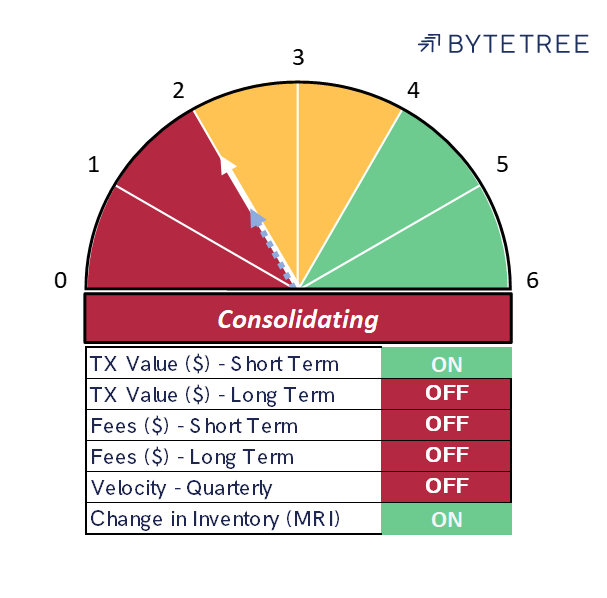
The Network Demand Model remained at 2/6 at the end of the week, still at a level deemed to be “OFF”. While Bitcoin has had an impressive bounce from the May lows, network activity remains subdued. Therefore, it is of little surprise to us that the price has failed to break out of the range established since early August.

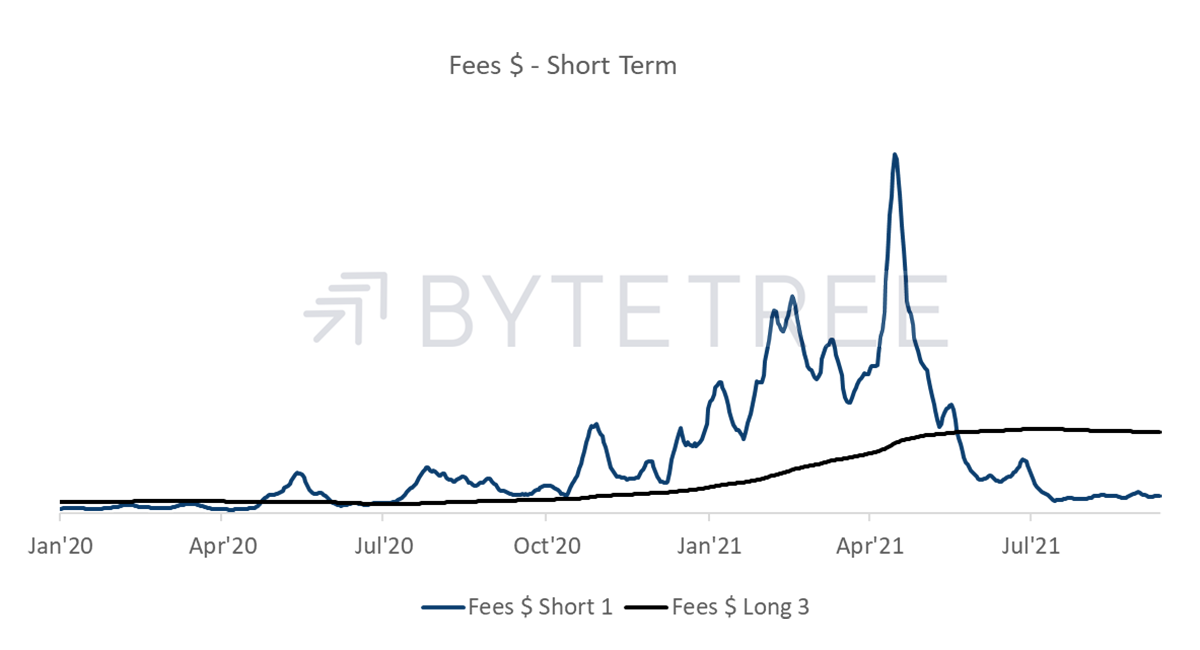
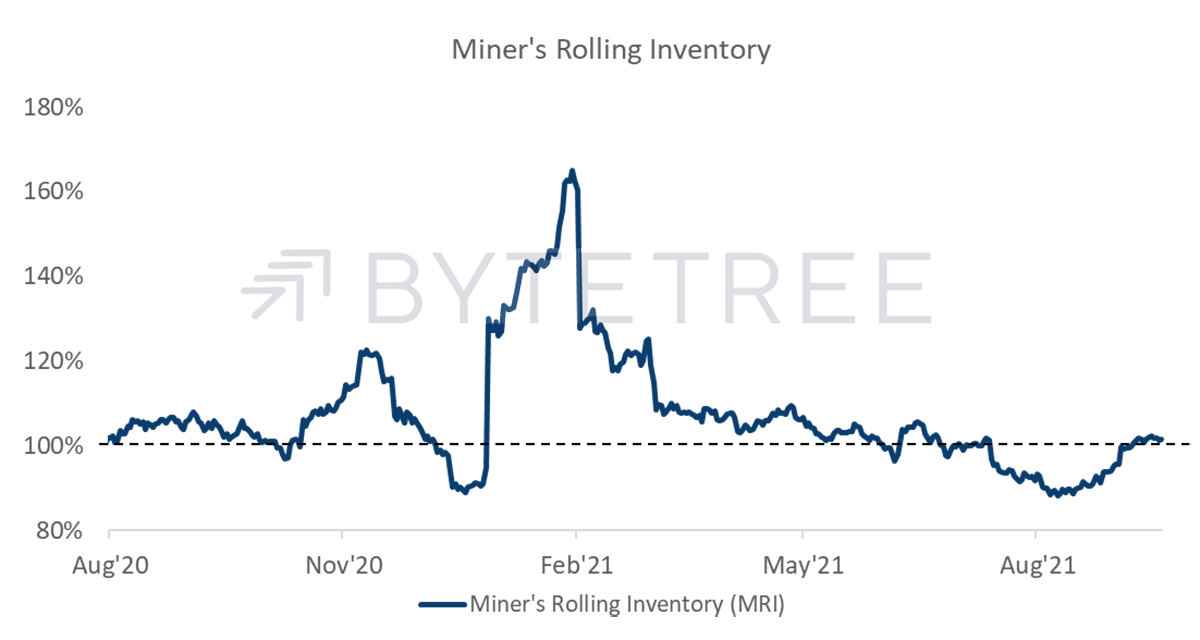
The two signals that remain “ON” are short-term transactions and miner’s rolling inventory (MRI). Fees, which historically have been a strong indicator of a thriving network, remain very soft. What is striking in the long-term fee indicator chart below is that the long-term moving average (black line, calculated over 52 weeks) has actually gone negative over the last month or so.

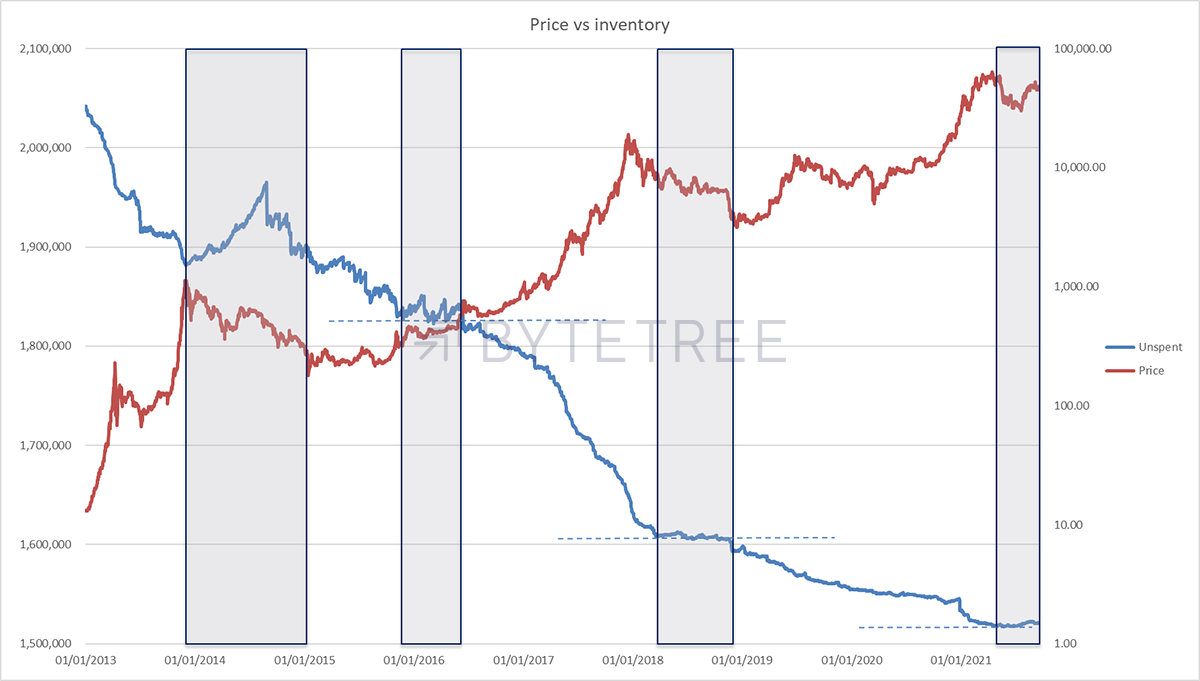
This means that the miners are more reliant than ever on selling their newly minted bitcoin into the secondary market to pay the bills. One might assume that they are enjoying substantial margins at current prices, and therefore the inclination to unload is minimal. This would change, of course, if there were a broader sell-down, necessitating the unwinding of inventory. History tells us that a structural bull market is incompatible with periods when unspent inventory is rising, which is the situation we are now in. This is shown in the chart below, where the shaded areas are periods of rising or stagnating miner inventory.

That said, miners were able to increase their selling activity at the start of the month as investors returned from their holidays. It might be a short-lived burst, as activity has tailed off over the last week.

Overall, network demand remains soft. Until this changes, it is hard to envisage sustained price strength.
A quick heads up ahead of tomorrow’s ATOMIC as the ByteTree score for bitcoin has dropped to zero. More tomorrow, but be in no doubt, the technical picture has deteriorated and is now looking weak.


