Bitcoin Network Demand Model

Disclaimer: Your capital is at risk. This is not investment advice.
Week 41 2021
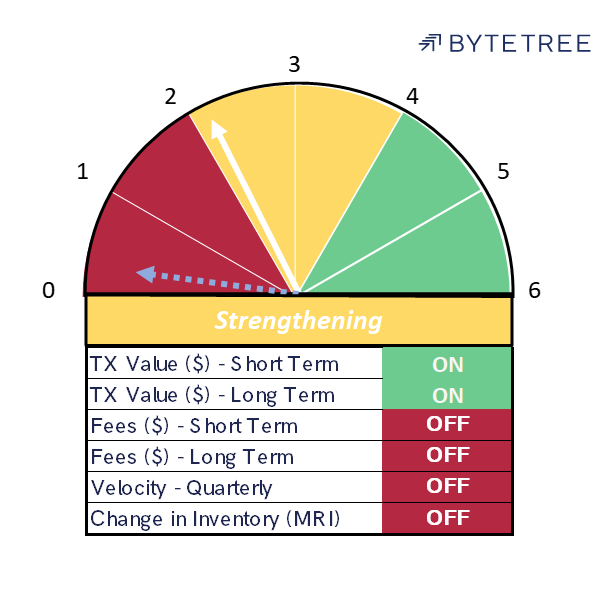
Having come from 0/6 last week, the Network Demand Model finished the period on 2/6, with both the short- and long-term transaction series turning on. During the week, Miner’s Rolling Inventory (MRI) flickered between on and off, so we have been at 3/6 during the week.
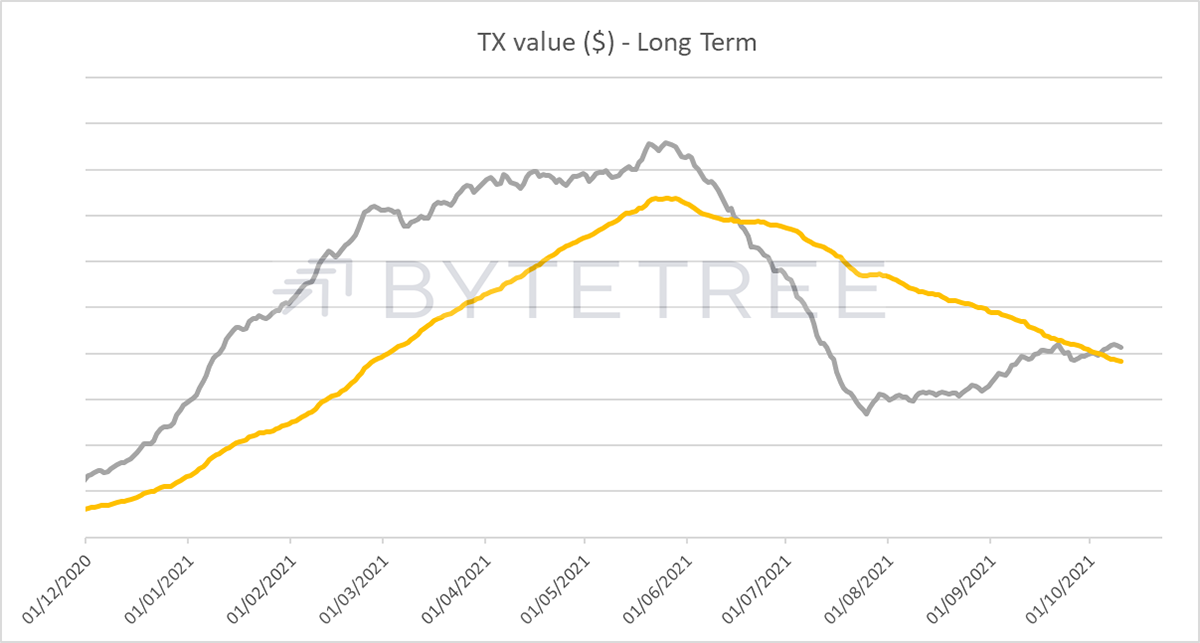
It is particularly notable that the long-term transaction indicator has turned back on for the first time since the 17th June, when the price closed just below US$38,000. Unlike the other metrics, the transaction (TX) series are in part driven by the bitcoin price, so they are inherently reflexive.
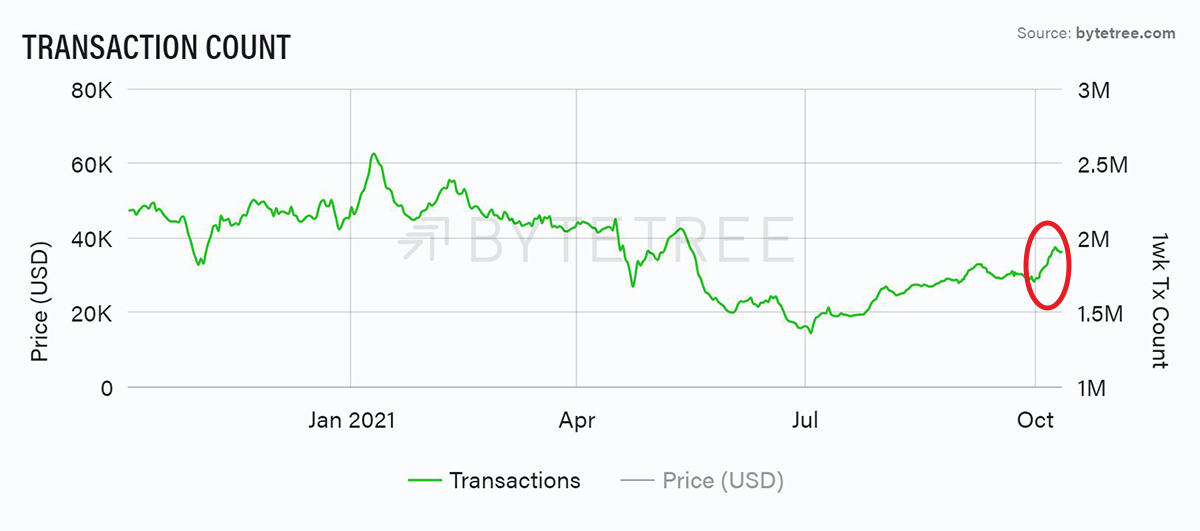
That said, what is encouraging is that the uptick is driven by transactions as well as price, as shown below. Note how transactions have picked up sharply since the start of October.
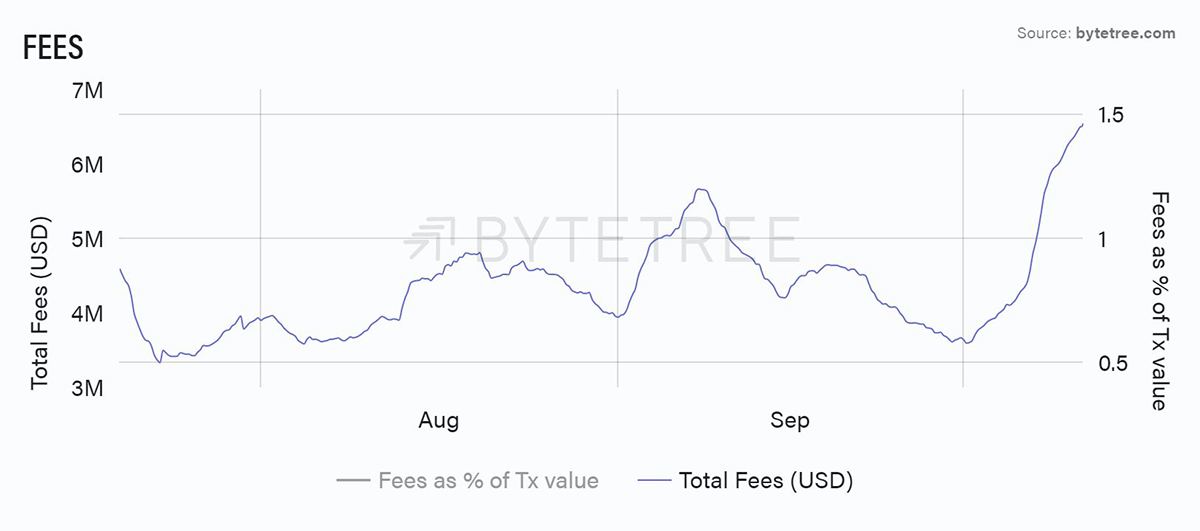
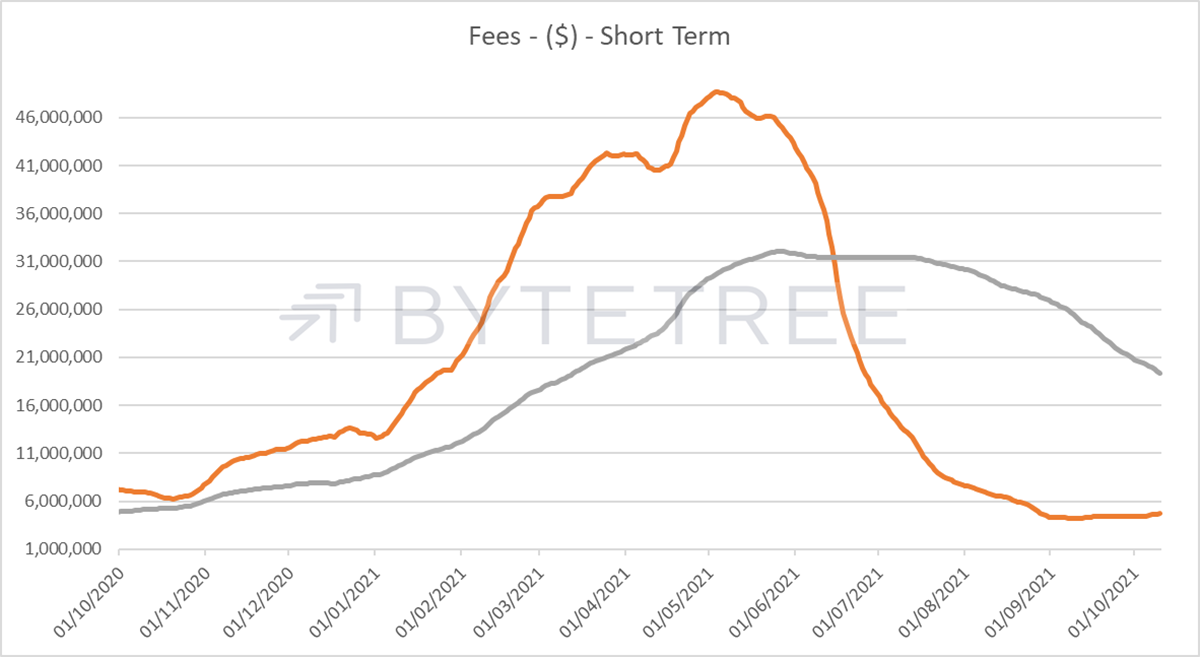
This is corroborated by a recent uptick in fees, which again shows us that the network is becoming more active. Fees have historically been the strongest cyclical indicator of network health.
This is, however, only a short-term picture. For the model to turn bullish on a cyclical basis we need to see much more evidence that this is sustainable. At current levels of activity this is a couple of months away.
Miner behaviour remains generally neutral. They have broadly speaking being selling about the same amount as they are minting. It will be interesting to see whether they become more aggressive over the next few weeks at these higher price levels, especially now that network difficulty has again adjusted upwards, and energy costs are on the rise.
The recent uptick in activity is encouraging but far from conclusive, and the price has run hard already. Keep a sharp eye on transactions and fees in the near term to establish whether this latest move has legs.

Comments ()