Bitcoin Network Demand Model

Disclaimer: Your capital is at risk. This is not investment advice.
Week 45 2021
The Bitcoin Network Demand Model remains at 2/6 and the Ethereum model at 5/5, both of which have been unchanged since the 14th October. Momentum has softened a fraction for bitcoin but remains strong for Ethereum.
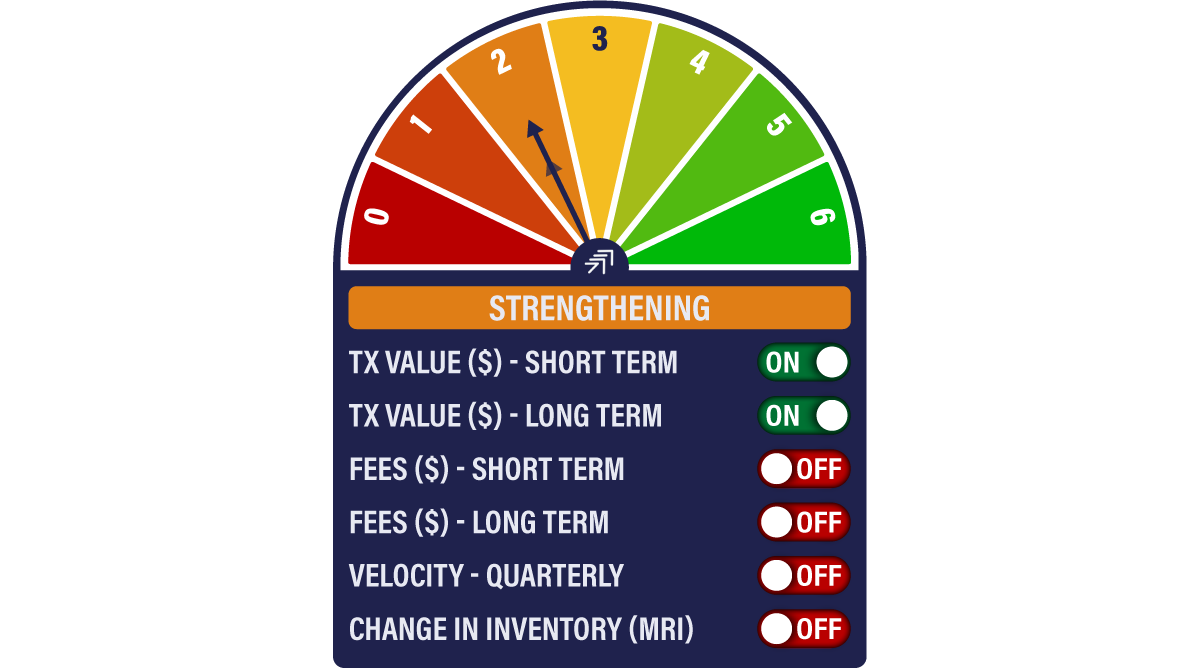
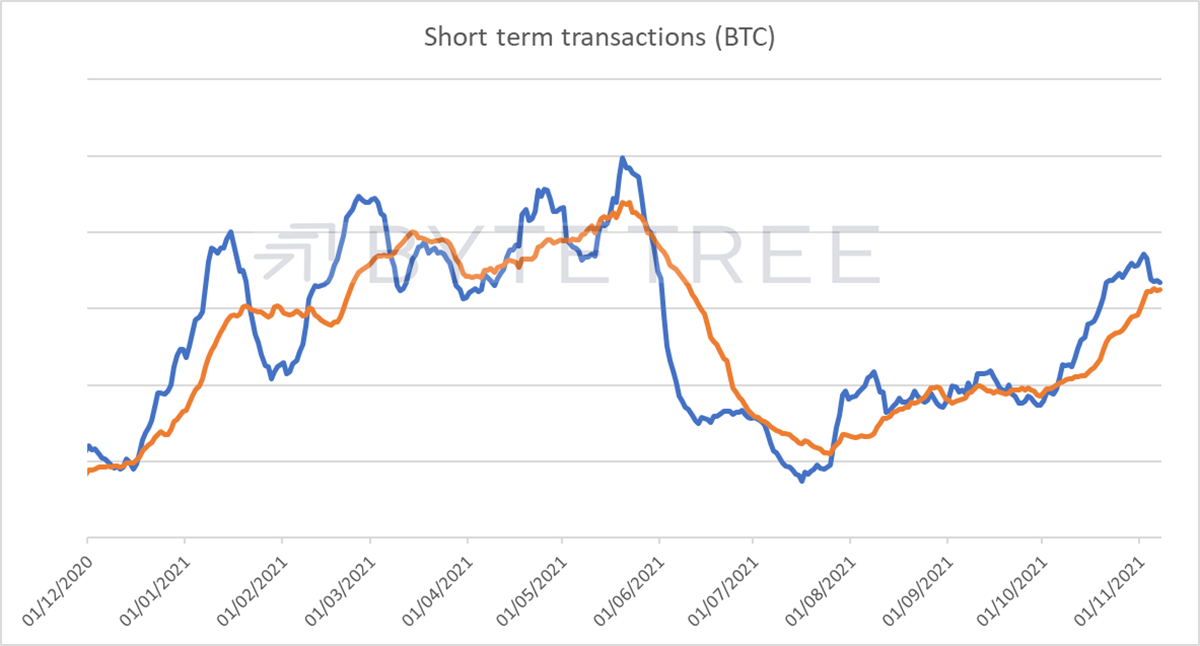
The short-term transaction series for bitcoin has been distorted somewhat by an abnormally large day on Thursday 21st October, a couple of days after the US ProShares Bitcoin Futures ETF launch. It is hard to tell whether the two events are related, but the effect has been to pull down the shorter term of the two lines in the chart below (blue), although it remains above the longer-term orange line.
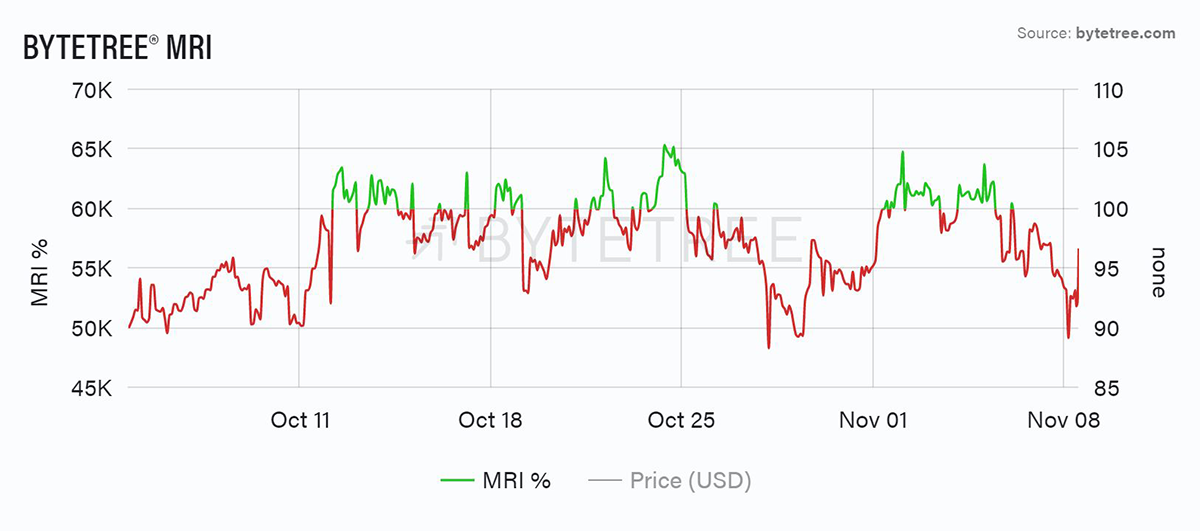
The miners also appear in no hurry to sell. MRI continues to trend below 100%, indicating that they are holding more than they are minting, as shown below. This suggests that there is no pressure on costs that is forcing the miners to sell, and also that they don’t see a topping market.
First Spend, which is a measure of coins sold by miners and thus being traded for the first time, has declined substantially as a percentage of Total Spend (i.e. total transactions), as can be seen in the chart below. It demonstrates that its significance in bitcoin’s price formation is not as important as it once was.
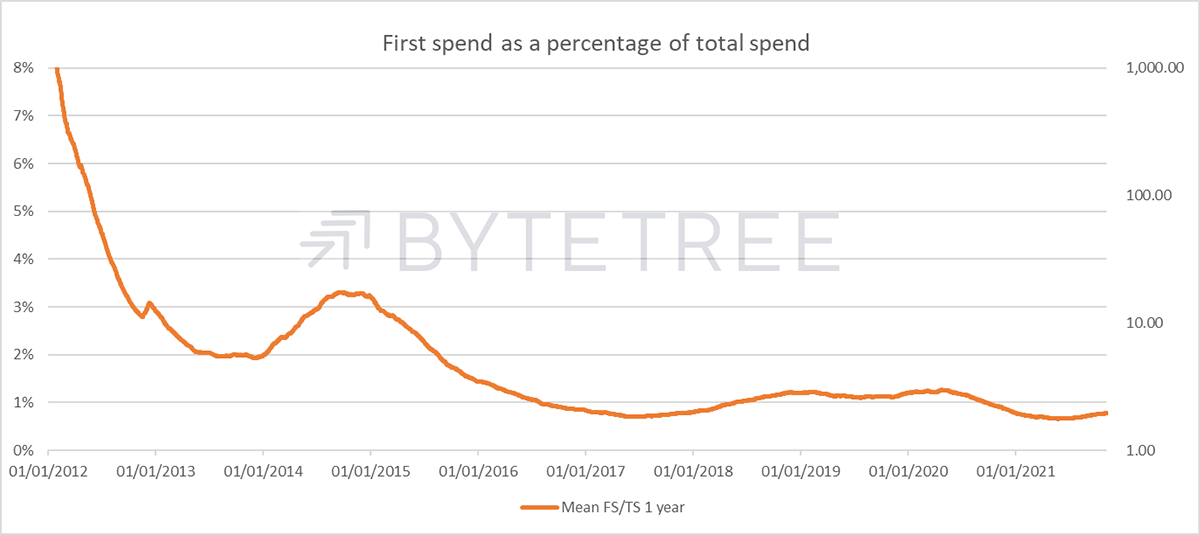
But maybe there is signalling information to be aware of. When we look at First Spend as a percentage of Total Spend (FS/TS), but in this case in relation to its own history (i.e. averaged out over the last year), it’s interesting to note that although the miners are currently hodling more than they are spending, they are actually in less of an accumulation phase than they were.
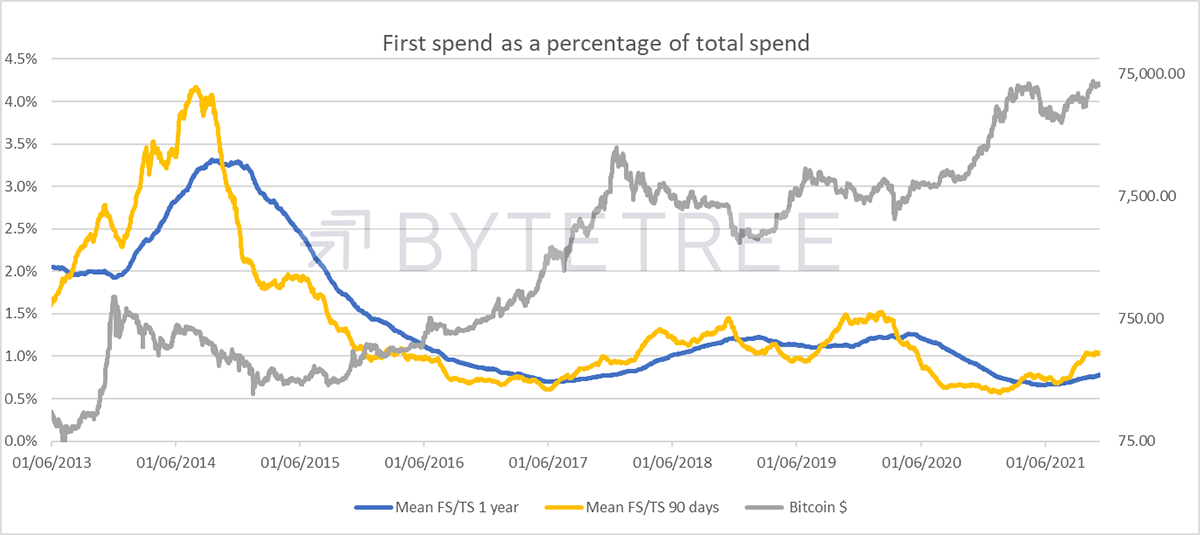
Typically, when we have seen the 90-day average of FS/TS (yellow line) below the 365-day average (blue line), it’s been a good time to be accumulating. The miners are telling us that they see better times ahead. The reverse is not so obviously true, but a large divergence, when yellow moves above blue, has historically suggested that the best is probably past. It doesn’t look like we are anywhere near the panic stage yet, and indeed the massive bull run in the second half of 2017 continued several months after the miners flipped their behaviour. But this change in stance is something we’ll be keeping an eye on. Also, note that any number below 100% on MRI constitutes inventory stocking, so the miners clearly remain relaxed about prospects.