Bitcoin Network Demand Model

Disclaimer: Your capital is at risk. This is not investment advice.
Week 44 2021
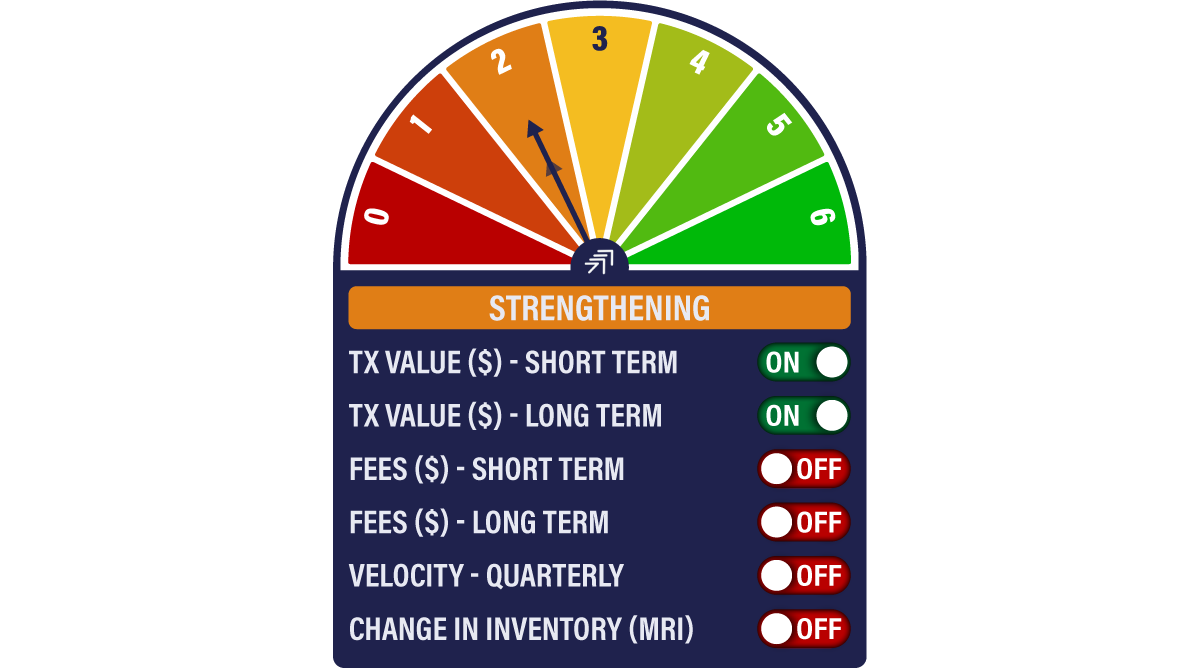
The Network Demand model remains at 2/6 for the third week running, with similar trends to those we have recently seen.

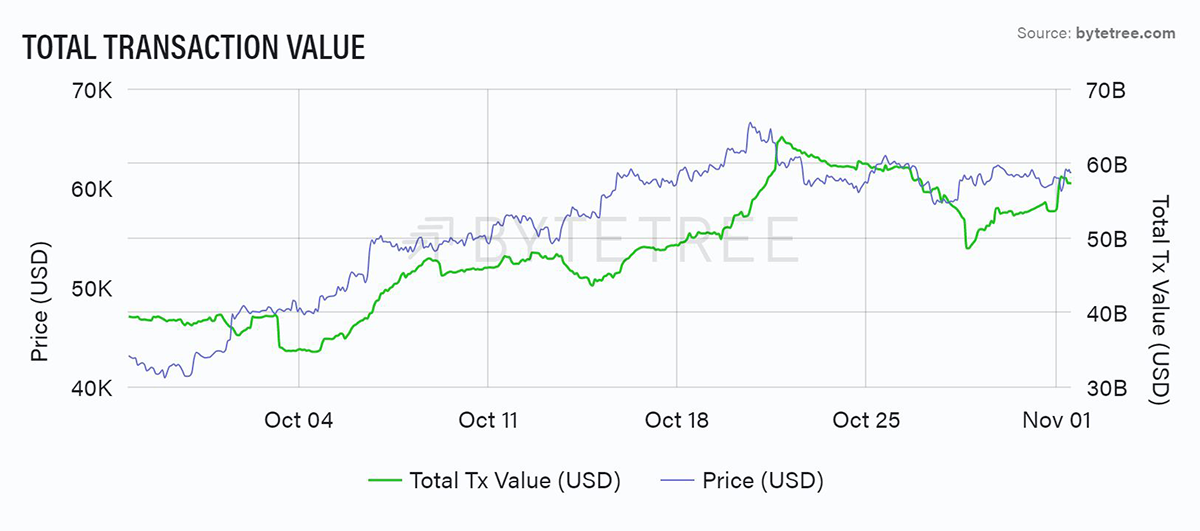
Transaction activity remains healthy. Understandably, we have seen a small decline since the bitcoin price peaked on 20th October, but as the price consolidated, so did transaction value. Latterly we see a recovery, which, combined with our other on-chain parameters, should be taken as a positive sign.

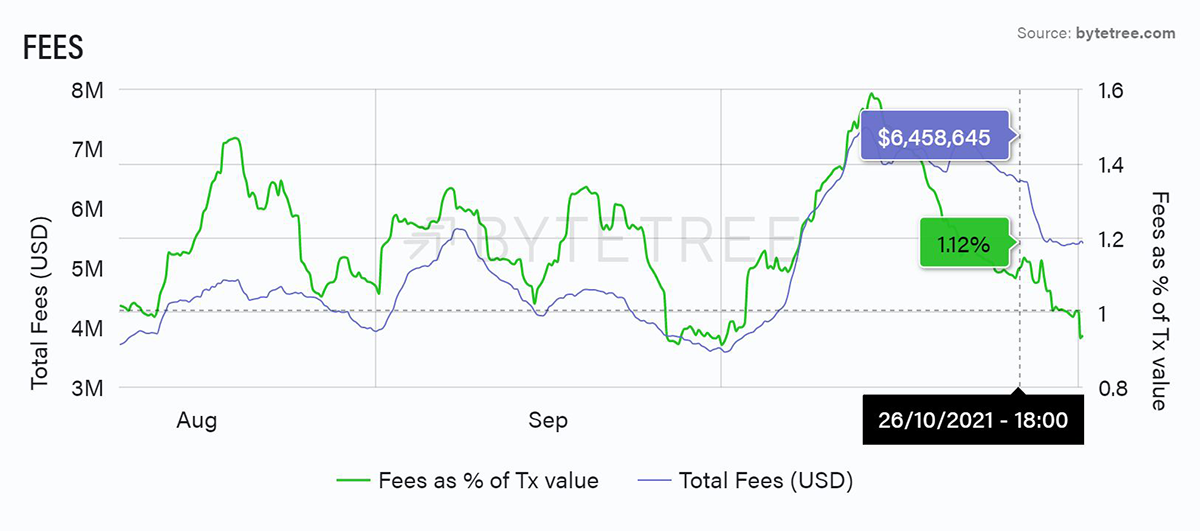
Fees continue to consolidate in our model, but the signal will take a while to turn on because of the giant mid-year spike which comes out of the numbers at the end of this year. The recent environment is far from unhealthy, however. The current low fee environment means that the cost of transacting is not too high to stifle growth. We can see from the following chart how fees as a percentage of transaction value (green line) have recently dipped, yet total fees (blue line) have trended higher. It’s a goldilocks scenario - miners continue to be healthily incentivised to protect the network, but fees are not too high to choke off growth.
Note how similar the green line is to the start of October, just before the run-up in price.

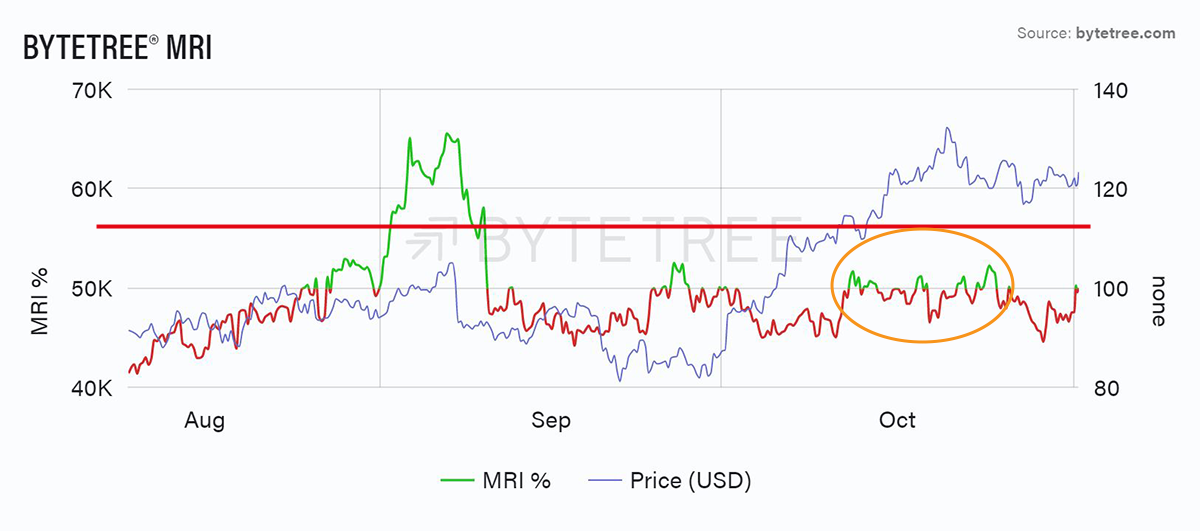
Recent activity from the miners shows that they have been happy to sell more than they have been minting above a price of US$57,000 (see chart below). The fact that the price moved decisively higher from that level confirms a sudden spike in demand. There was an understandable lull in the aftermath of the all-time high, but we see a recent bounce to the 100% line. It will be interesting to see whether the start of a new month brings fresh demand, as was the case in October.


Comments ()