Gold in 2022

Disclaimer: Your capital is at risk. This is not investment advice.
Atlas Pulse Gold Report - Issue 66;
With rates so low, inflation is key for gold in 2022. If it keeps on rising, that will see gold perk up while equities cool off. Short-term inflation measures are already moving higher as the Omicron variant seems to be pretty mild. And even if it isn’t, we now know that lockdowns stoke inflation rather than solve it.

Highlights
| Regime | The equity bubble bursting |
| Macro | Inflation |
| Valuation | A more bullish take from regression |
| Flows and sentiment | Asset allocators should be ashamed of themselves |
| Technical | Rangebound |
It is hard to imagine gold being a laggard in 2022. There is so much excess, and inflation seems poised to show up our central bankers. Investors are lightly positioned, and sentiment is shot to pieces despite gold matching the S&P 500 since 2018. Who knew?
Regime
These pages keep on stressing that a decent gold bull market is helped by stress in equities. Don’t read too much into that, as it’s obvious. Demand for alternative assets rises when the core asset classes wane.
Ask any decent technician, and he’ll tell you that stockmarket breadth is collapsing, which means fewer stocks are driving this rally. Speculative stocks are in trouble, and we’ve even had a Hindenburg Omen (imminent crash signal) for the first time since February 2020.
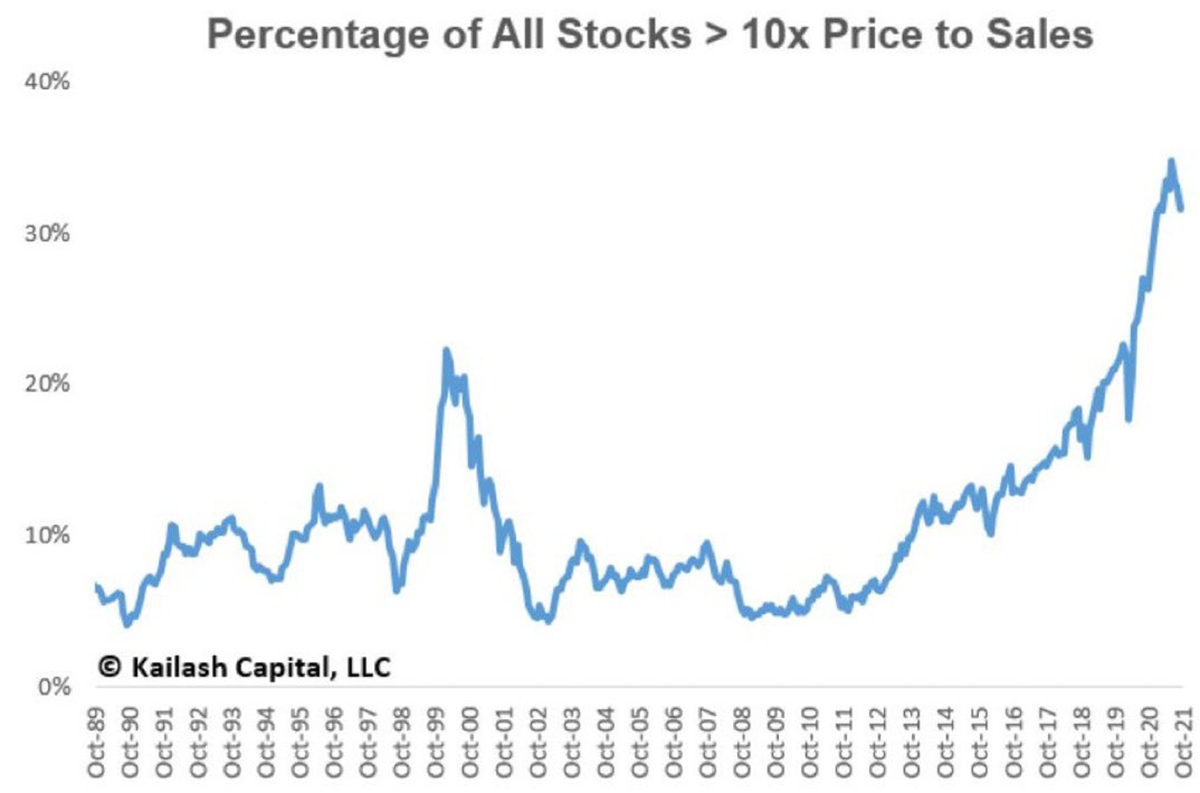
Yet this cycle keeps on giving. Everyone knows valuations are at records along with the combined weights of the top five stocks. No one seems to care. I love this chart which shows the level of excess (HT @Callum_Thomas).
Yet the S&P 500 marches on. The chart shows the relative relationship whereby gold was winning from 2018 to 2020 only to give it back since. In recent months, gold has only narrowly lagged equities on a four-year view.
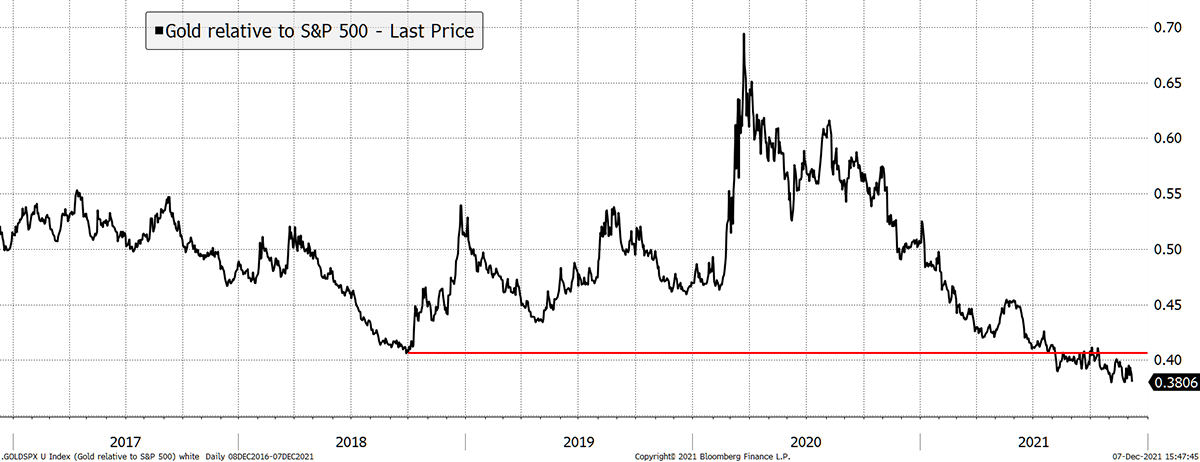
Perceptions are much worse than reality. Most people believe gold has slumped while equities have surged. Yet their recent track record is much closer than many think.
Macro
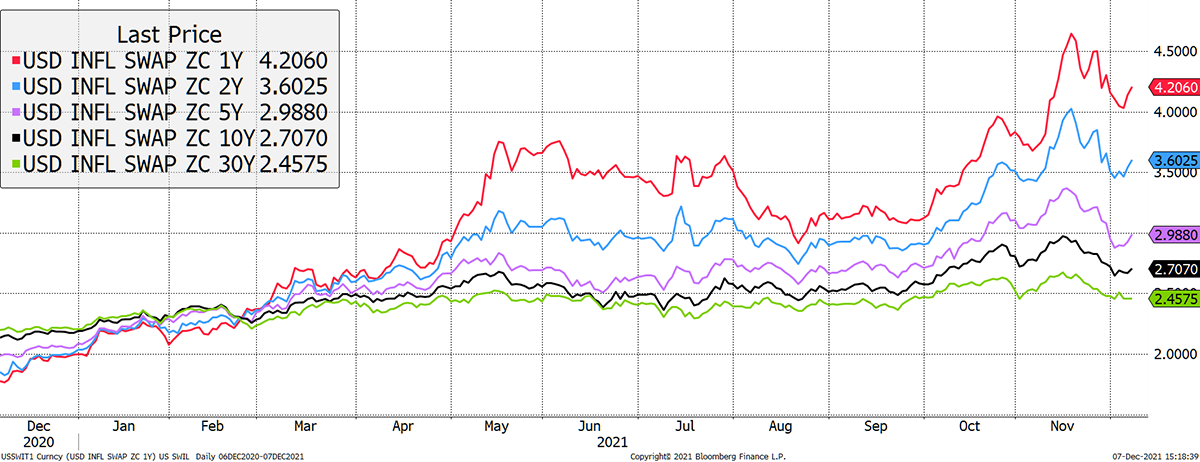
Inflation is key for gold. If it keeps on rising, that will inevitably see gold perk up and equities cool. The recent pullback following the Omicron variant was mild. Better yet, shorter-term inflation measures are already moving higher, which could see real interest rates resume their decline.
Just a Dip
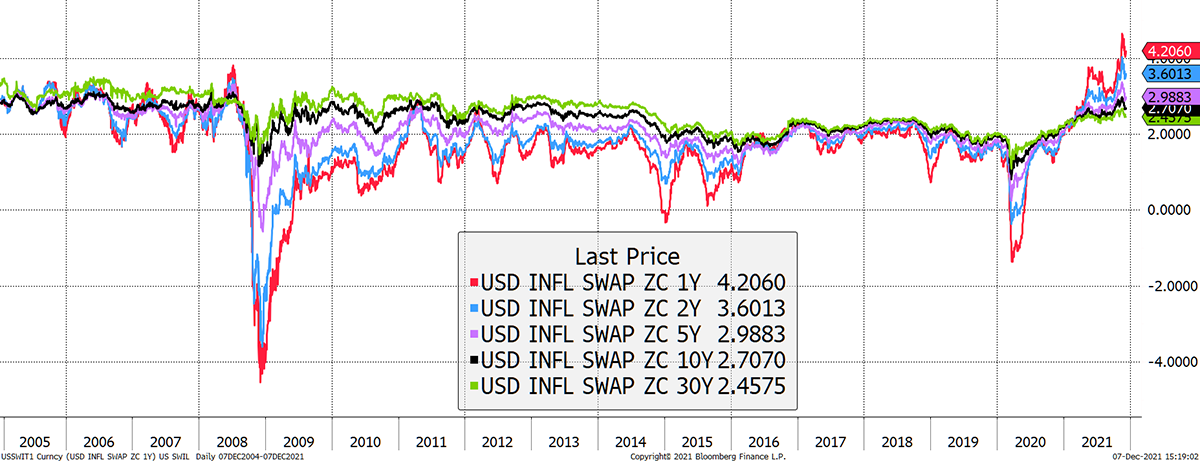
Looking longer-term and you can see how something has changed. For the first time in a long time, the red line is above the other lines. For most of the time post-2008, the red line was below the others as the overriding fear was deflation. As this continues, the short-term inflationary pressure will drag the long-term expectations higher.
Red Leads
As the most famous store of value, we believe gold is somehow linked to inflation but can’t definitively prove it. I have certainly embraced that idea in my models, but I do wonder if there’s more to it. Perhaps this is understated. Gold relative to CPI since 1950 makes it look expensive.
Gold in Real Terms
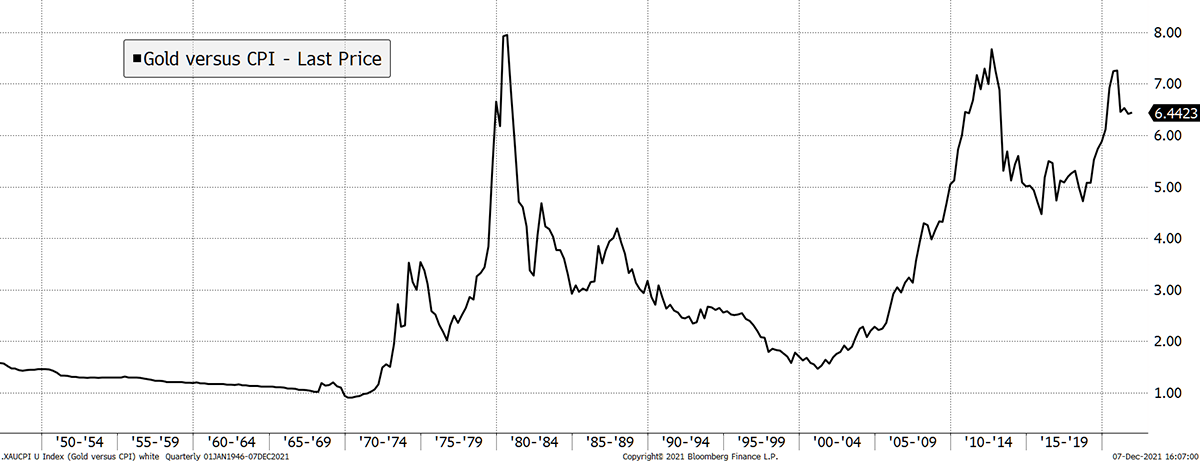
But I don’t believe that. Regimes change, and if you look at the version of that chart dating back to 1720, then all seems to be in order.
We also know that inflation is somehow linked to the money supply, but that relationship isn’t entirely clear either. The money supply will either end up in economic growth, inflation, or a mix of the two. In any event, the gold price has merely matched the money printing.
The Money Printers Go Brrrr
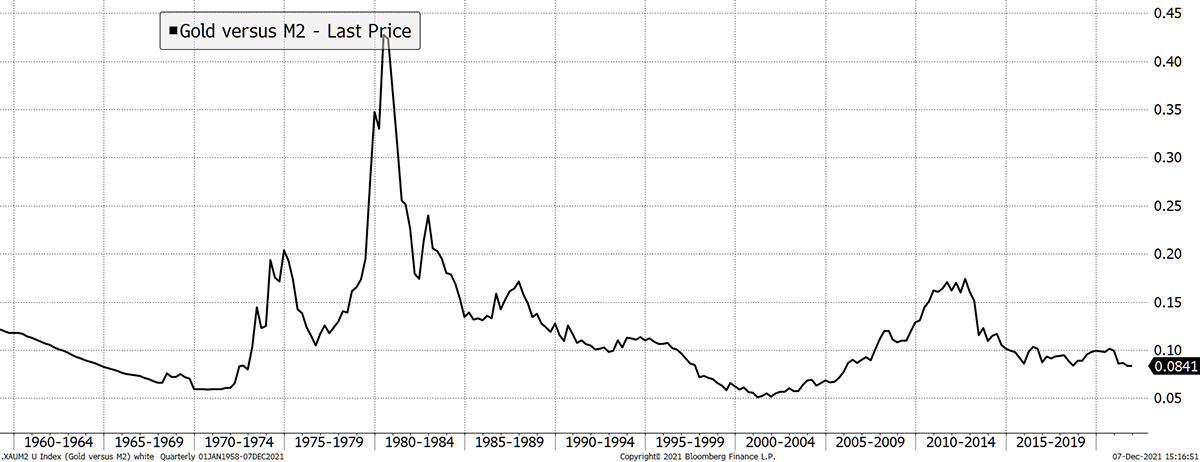
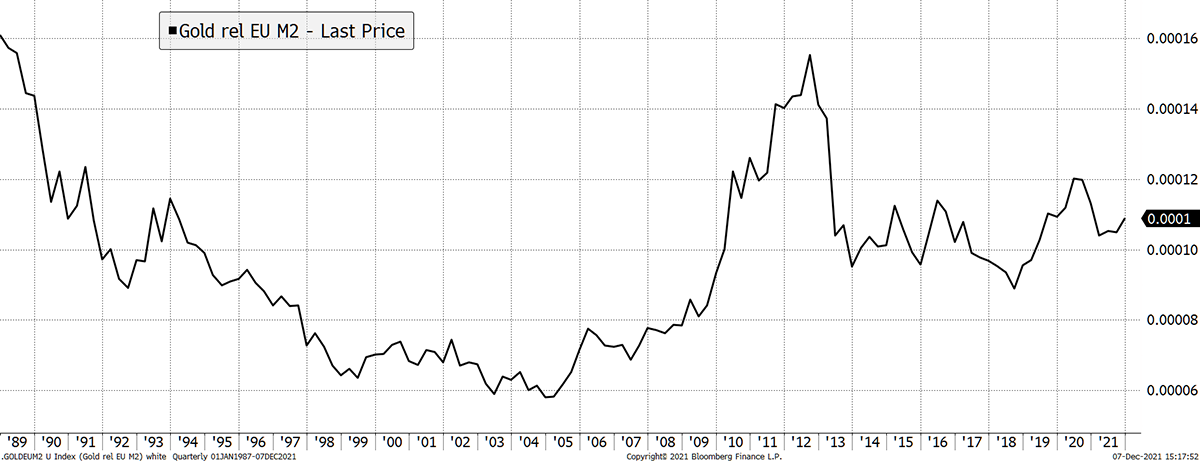
That can be seen in Europe, with less data, gold in euros against M2 for the eurozone. It trades close to the three-decade average.
EU Brrrr
Then when you look at the gold price in euros over the same period, the trend rate is 7.2% per annum. That is marginally less than the printing, and the price is in the middle of the range.
Gold in euros looks like a good bet
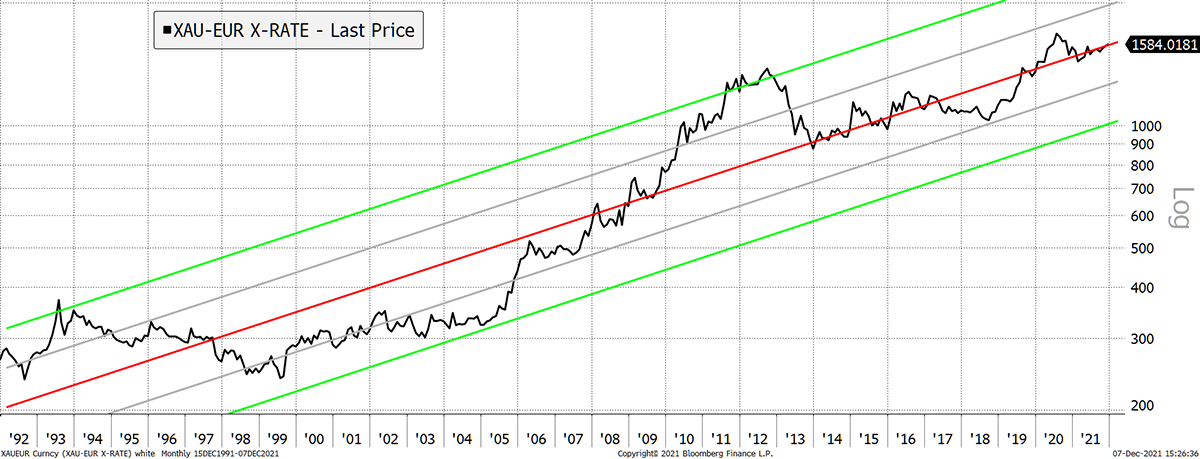
It is a reminder that this asset is currently undemanding.
Valuation
If you missed November’s issue, then please have a look at the valuation section before you read on.
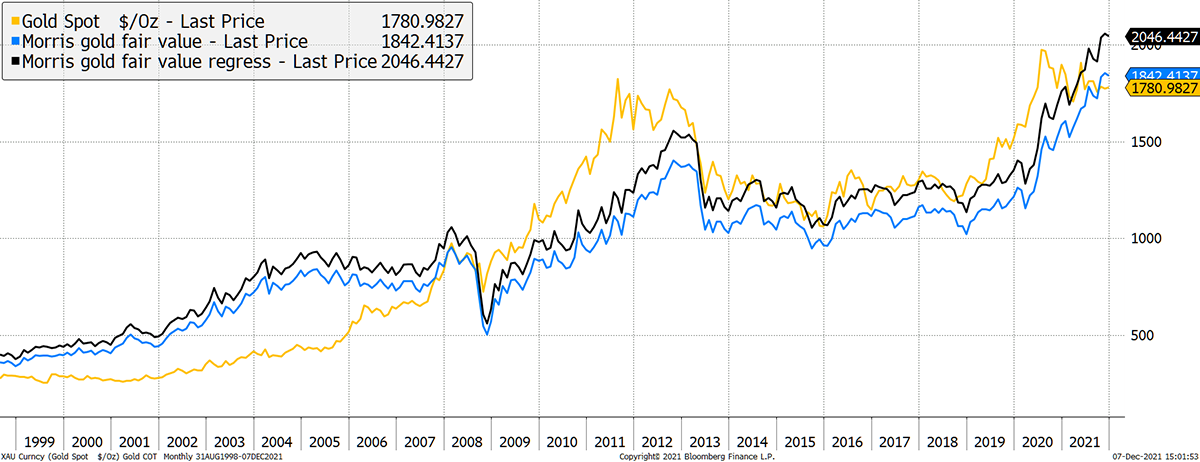
With more time passing since the last model calibration, I harshly recalculated the historical average, which took nearly $200 off the fair value. It is harsh because the historical average is weighed down by the prolonged period of undervaluation from 1998 to 2005.
I have no doubt that this is the correct way to calibrate gold to rates and inflation over the long-term, but we only have 23 years of data. Maybe in another 20 years, we’ll know more.
A best fit is the other method, which give less weight to extremes. The harsh historical average is shown in blue with the best fit (or regression) in black. The difference is $204 (or 11%). That’s not huge but helps to build a range. Currently, the gold price is below both measures.
Gold and TIPS
ByteTree’s gold models are updated daily, and the regression model will be added in due course.
Flows and Sentiment
As I said, I hope you read last month’s issue because there were some good charts that highlighted how bitcoin funds were now 30% as large as gold funds, which is remarkable. Even more so is how bitcoin funds are 2.5x larger than the silver funds. How the world has changed. I reiterate that bitcoin has disrupted silver more than it has gold.
Silver will perk up at some point. Cheap assets always come good so there’s no issue. The bigger issue is why institutions aren’t adding to gold?
This happens because there is this extraordinary creature known as an “asset allocator”. When you meet one on its own, it is generally presentable, intelligent, and good company. Yet when they assemble as a herd, they can be relied on to do the wrong thing.
The asset allocator has been selling gold over the past week. How dare they!
Gold Funds Still Have Room for Growth
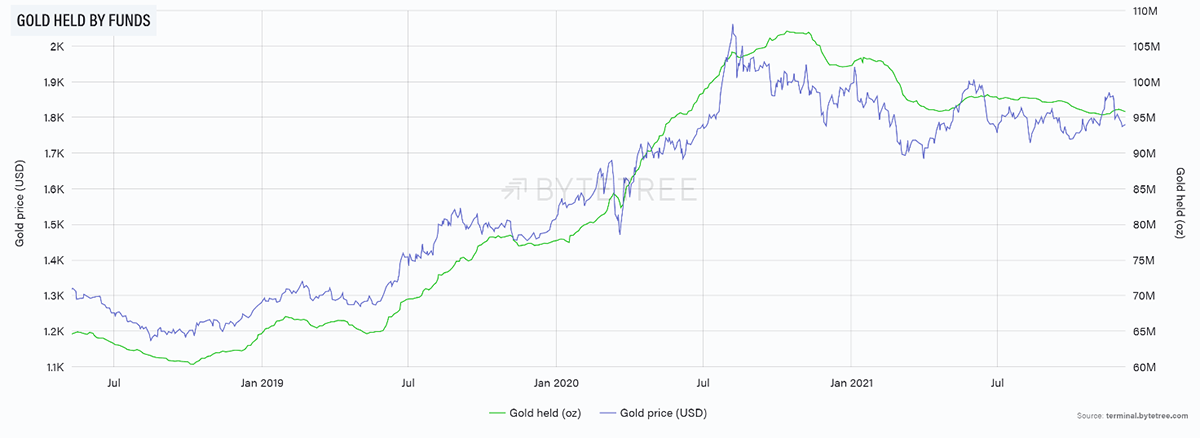
They will return at some point, but I suspect it will be too little too late. The allocators are squeezing the last drops from this most absurd equity bull market. The smarter ones are preparing for the worst and swapping equities for gold.
Technical
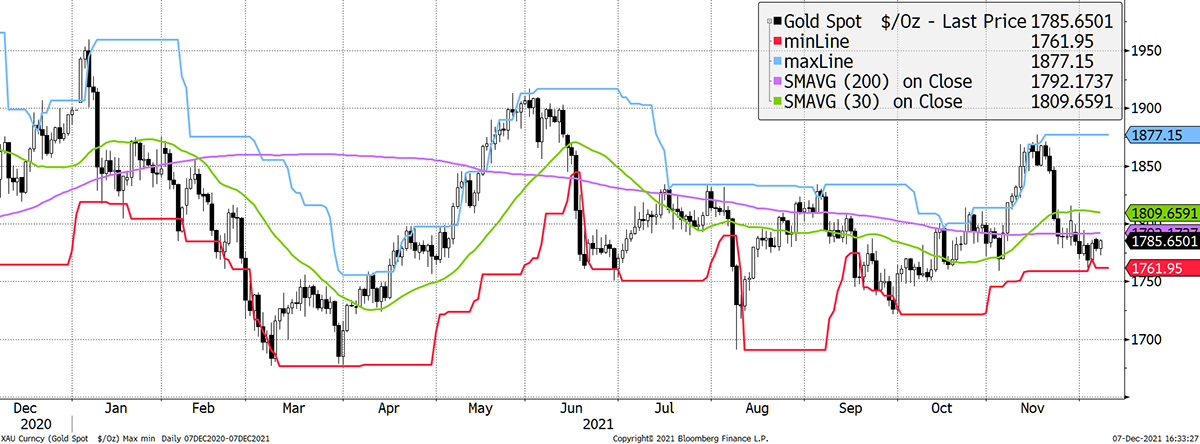
ByteTree Premium ATOMIC readers are familiar with ByteTrend. It enables a trend to be quantified, which helps to remove emotion and provides a comparison across many charts for cross-market screening. A ByteTrend score gets a point for each of the following criteria:
- Price is above the 200-day moving average
- Price is above the 30-day moving average
- 200-day moving average slope is rising
- 30-day moving average slope is rising
- The last touch of the max/min lines was blue
This highlights the difference between gold in dollars, which scores a 1 out of 5 (only the 200-day moving average slope is rising), and gold in euros, which scores 5 out of 5 (all conditions are met).
The dollar gold chart is noisy, but on the plus side, the lows have been climbing since March.
Gold in Dollars Is Sluggish
The euro gold chart is bullish. There was a clear breakout, followed by a pullback. Get in while you can.
Gold in Euros Is a Screaming Buy
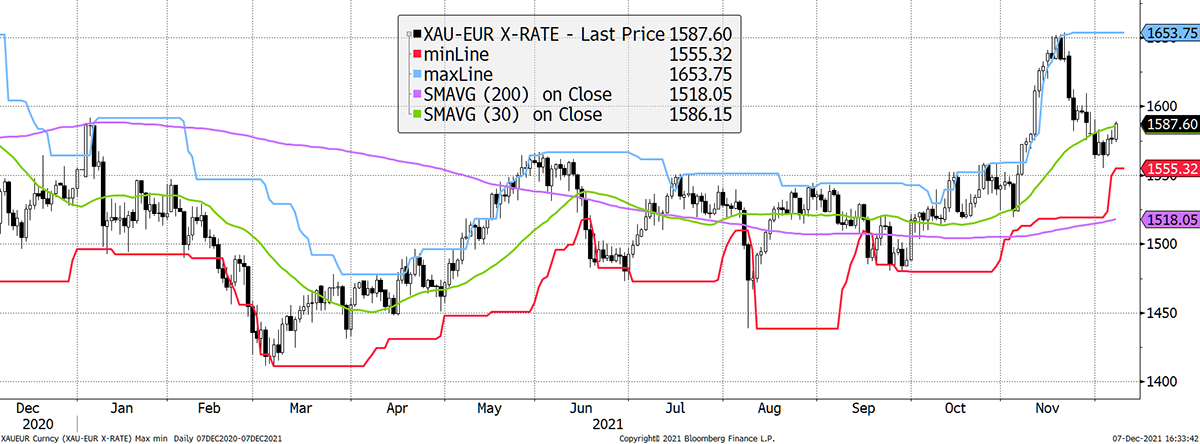
Gold is the same wherever you take it, and so the difference is the currency. With most global investors thinking in dollars, there is seemingly no urgency to buy gold for them. But for those outside the dollar zone, they better get on with it. Charts like this tell me it is only a matter of time before this bull market resumes.
Where the euro leads, the dollar will follow.
Summary
In a haze of misinformation, 2021 went like a flash.
With rates so low, inflation is key for gold in 2022. If it keeps on rising, that will see gold perk up while equities cool off. Short-term inflation measures are already moving higher as the Omicron variant seems to be pretty mild. And even if it isn’t, we now know that lockdowns stoke inflation rather than solve it.
I wish you all a Merry Christmas and a Happy New Year. I remain bullish. Thank you for reading Atlas Pulse.
Thank you for reading Atlas Pulse. The Gold Dial Remains on Bull Market.
Charlie Morris is the Founder and Editor of the Atlas Pulse Gold Report, established in 2012. His pioneering gold valuation model, developed in 2012, was published by the London Mastels Bullion Association (LBMA) and the World Gold Council (WGC). It is widely regarded as a major contribution to understanding the behaviour of the gold price.
Please email charlie.morris@bytetree.com with your thoughts.

Comments ()