Finding the Winners in Crypto

Disclaimer: Your capital is at risk. This is not investment advice.
ByteTrend: Part 2
With nearly 20,000 cryptos to choose from, it is hard to pick winners, especially when they all rise and fall together. It would take a lifetime to read all the whitepapers, let alone studying independent research and finding the time to digest it all.
There are so many pitch documents promising untold riches, some of which might even turn out to be true. The trouble is that where there’s money, there are also scams. It’s tough being a crypto investor, especially during the crypto winter. Where to start?
The leading pricing sources such as CryptoCompare or CoinMarketCap are where most journeys begin. When I open those pages, I am overwhelmed by the noise and feel a need to better organise the information for an analytical mind.
One of my dirty secrets is that I am a member of the UK Society of Technical Analysis and sit on their investment committee. From time to time, I contribute to their monthly publication or host talks on various technical subjects. I took their exams back in 1999 and gained a distinction.
I later learned to write code in Visual Basic (thanks to a French intern back in 2001) and went on to build numerous models to help me identify investment opportunities. Over the years, these have been refined, and one that solves a problem in crypto is ByteTrend. It cuts down a list of nearly 20,000 tokens to just a handful of the things you need to focus on.
Here is a short piece explaining how ByteTrend works.
Not when to buy, but what to buy
ByteTrend makes no claim about predicting the future, nor does it tell you when to buy low and sell high. It guides you on what to buy in a complex universe that is full of noise and does so by analysing the trend.
This is the first important thing about technical analysis. Amateurs think it is a timing tool. Look at this or that indicator and trade accordingly. The pros have learnt the hard way that indicators can be useful but prove to be unreliable over time. Technicals are better at telling you what to buy rather than when to buy.
I know that because back in the day, there used to be a 52-week highs and lows box in the markets section on the back pages of the Financial Times. As an amateur, I remember thinking how the new lows must be cheap, and that was where the opportunities could be found. Like most investors, it took me several years to realise I had it the wrong way around.
New highs are a buy
Amazon is a good example of this because it has created so much value over the past 25 years. Presumably, most of us wish we owned more Amazon than we did as it returned 36% IRR compared to 8.7% for the S&P 500. Incredible stuff.
Amazon’s IPO took place in 1997 and has been trading for around 6,250 days. In that time, it has made 376 new all-time highs. The point is that each one of them was a reminder that this company was worth owning. Had you been looking at the new lows, you’d have found the likes of Enron, Blockbuster or Sears cropping up time and again. A great lesson in running your winners!
Some of Amazon’s all-time highs occurred in the late 1990s, but the majority came about after the financial crisis in 2008. It is remarkable that Amazon fell by 95% in the 2000 to 2002 dotcom crash and then didn’t make a new all-time high until 2007. Since then, Amazon has risen 45-fold despite being a large cap stock at the outset. This reminds us of another myth, that only small caps can perform.
Applying ByteTrend to Crypto
A good starting point is to significantly shrink your universe as no one can handle 20,000 tokens. It has been shown that you don’t need to focus on the small stuff, and so ByteTrend focuses on the top 100 tokens.
Once done, the job is to screen for trends that are likely to make you money. This means finding where the value is being created, which means looking for technical strength. I have already highlighted that Amazon made 376 new all-time highs, 375 of which warned of higher prices ahead.
It’s not just new all-time highs, or even year or month highs, that provide the definitive answer in trend following. It is the general measure of trend strength, of which there are many. It matters less which trend-following indicators, rather than oscillators, you use, just that you apply them consistently. That is why I have deliberately kept it simple.
ByteTrend uses the 30- and 200-day moving averages (adjusted for weekend trading so 280-and 42-day in crypto) and 20-day max min lines. A max score of 5 (5/5) would meet all the criteria.
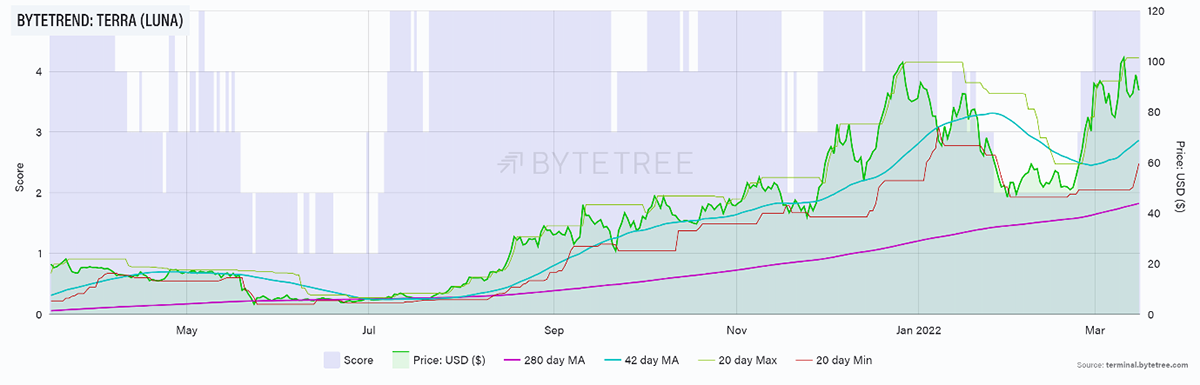
At the time of writing, ByteTrend shows just four tokens with 5/5 scores. These are Terra (LUNA), Waves (WAVES), Defichain (DFI) and Nexo (NEXO).
LUNA has been consistently strong since last summer after turning 5/5 at $6.71. It is now $88.58. Not a bad result.
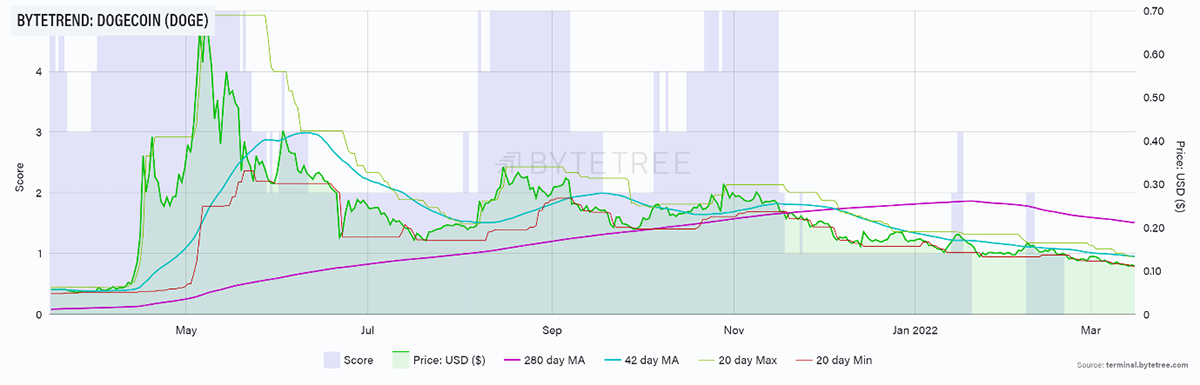
In contrast, a score of zero (0/5) is a trend that should be avoided. Cardano (ADA), Polkadot (DOT), Dogecoin (DOGE), Chainlink (LINK), Polygon (MATIC) and Stellar (XLM) all score 0/5 and have all seen significant capital erosion in recent history.
I highlight DOGE. The downward trend is underway, and statistically, it is likely to continue. Given it has zero fundamental value, I would agree, but highlight how dangerous it is to short hype situations when the trend is strong.
For those with their finger on the pulse, keep an eye on ByteTrend upgrades, where the scores have improved overnight (tip: you can sort columns by clicking on the column heading). This morning, Elrond (EGLD) shot up from a 1/5 to 4/5. The price had moved into a narrow range, and the subsequent breakout has given a strong signal. This could turn out to be chop (noise) or the real thing.
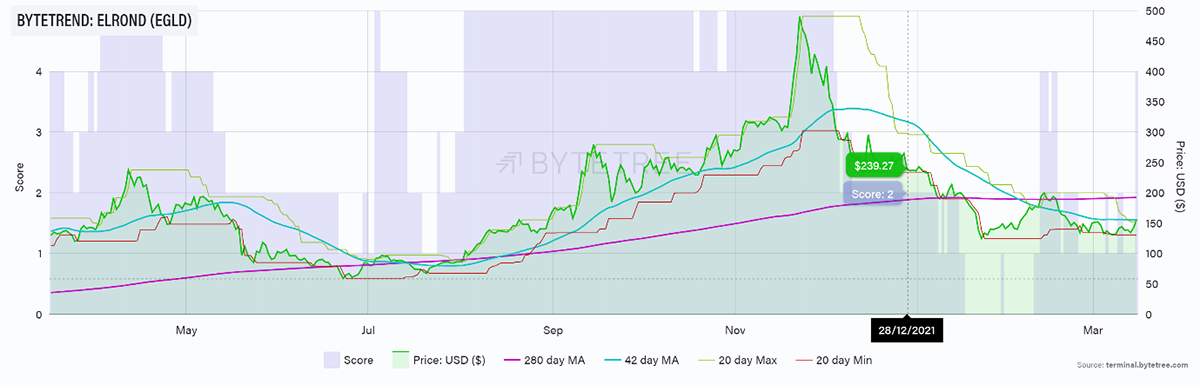
In EGLD’s favour, the 280-day moving average is still positively sloping, and the recent consolidation, with low volatility, has led to a “squeeze”. There are no guarantees that this turns out to be a great investment, but it’s certainly worthy of further research.
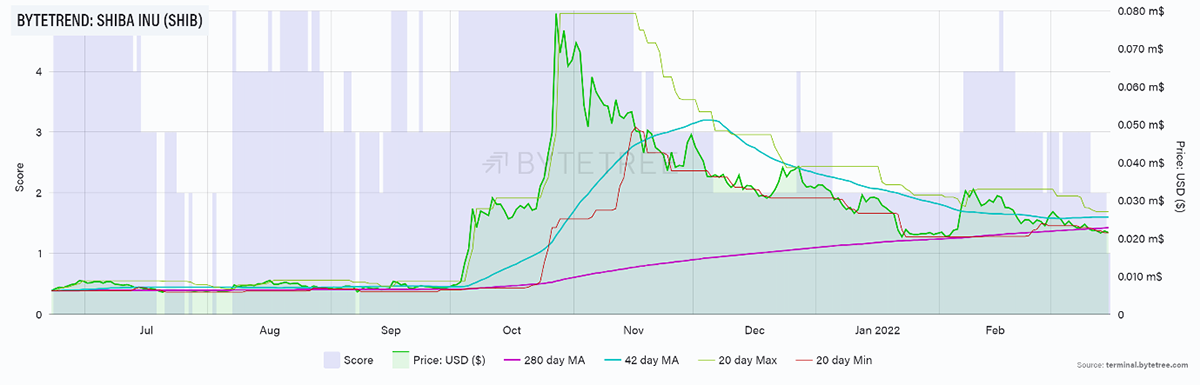
Or you might follow the downgrades. There were several today, but DOGE’s friend, Shiba Inu (SHIB) has dropped to a 1/5 as the 42-day moving average has now turned negative. Dead cat bounce?
Simplicity
None of these trend measures are rocket science, and they are all widely available. They do not magically forecast future prices, nor do they make you rich in a hurry. They help to identify assets that are statistically more likely to make you money.
The best bit is that the next great crypto asset cannot fail to score 5/5 at some point. At the very least, ByteTrend is a great starting point from which you can filter the cryptoverse and carry out further research.
In my next piece on ByteTrend, I’ll focus on crypto measured in BTC, ETH and the long-awaited ByteTree Crypto Average (BCA). Watch that volatility, which crypto is so well known for, simply vanish. Now that is magic.
Explore ByteTrend on the Terminal
The ByteTrend Article Series
- Part 1: Introducing ByteTrend: A Trend Following Strategy for Crypto
- Part 2: Finding the Winners in Crypto
- Part 3: The Power of Relative Strength in Crypto
- Part 4: Introducing the ByteTree Crypto Average (BCA)
Comments ()