Introducing the ByteTree Crypto Average (BCA)
Disclaimer: Your capital is at risk. This is not investment advice.
ByteTrend: Part 4
The Bytetree Crypto Average (BCA) was designed to measure the strength of the crypto market. Firstly, it is important to clarify that this is an indicator, which means it is uninvestable, and there is no fund, token or strategy to buy. Its use case is more important, as it captures a large amount of price data and summarises the overall market strength.
Most crypto indices are investable because they would typically weigh the crypto universe by market cap (cap-weighted index). That would currently give a 42% weight to BTC and 19% to ETH, meaning 61% of the overall measure is based upon the performance of the top two coins.
BCA looks at the top 100 tokens and records the average daily price move in USD, having stripped out stablecoins and wrapped tokens. To replicate this in real life, you would need to rebalance your 100-coin portfolio to an equal weight each day (equal weight or unweighted index), which is theoretically possible, but impractical.
To view BCA, visit ByteTree Terminal and select “ByteTree Crypto Average (BCA)” in the box, which defaults to USD.
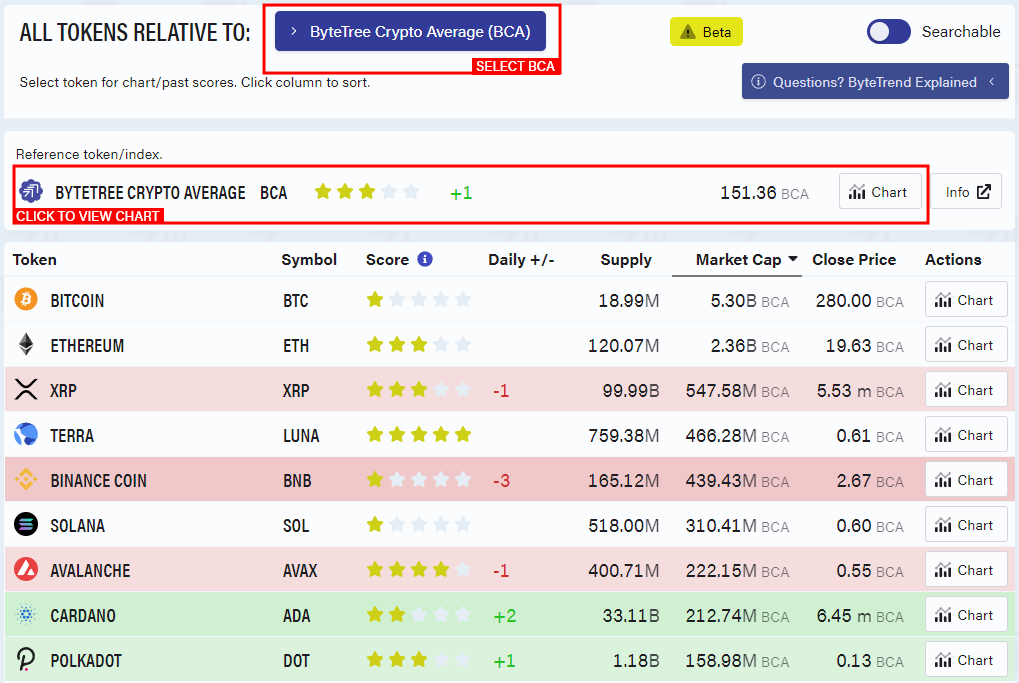
Then click on “ByteTree Crypto Average BCA” for the chart.
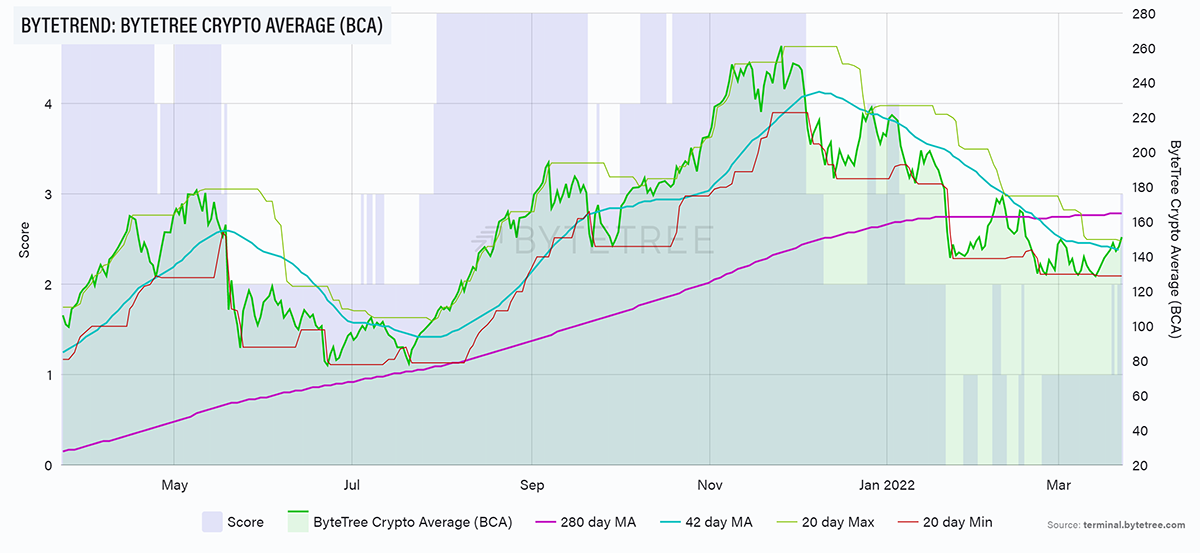
The current BCA score is 3/5, which is the highest reading since January this year. You wouldn’t be disappointed if you made a point of kickstarting your crypto portfolio when the BCA had first touched a 3/5 score and started to wind things down on the first signs of a 1/5. The BCA can be choppy, but the bull markets are well defined with sustained periods of high BCA scores. Have a look at the BCA score since 2013.
Crypto winters aren’t like the old days
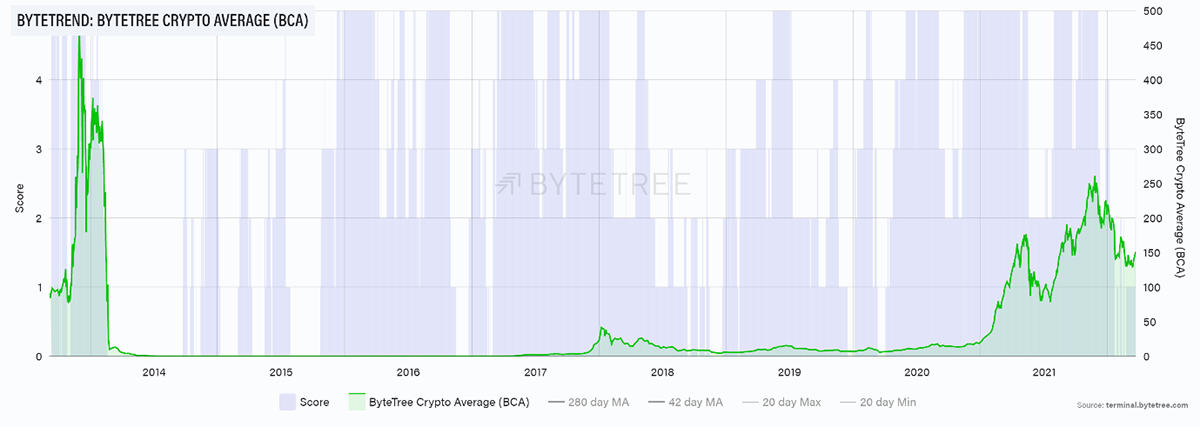
The BCA peaked at 460 in December 2013, falling to 0.1 by October 2015. That prolonged period of 0/5 in 2014 was a good time to be doing something other than investing in crypto.
The next peak was at 43.6 in January 2018, which saw the subsequent bear fall to 4.4 by December 2018. The second great bear in 2018 was a mere -90% compared to the previous 2014 bear of -99.99%.
The recent bear peaked at 261 in November 2021, and the low so far touched 128 in March 2022. It may yet go lower, but the point is that crypto bear markets are nothing like the old days, which gives this space credibility.
I reiterate, BCA is an uninvestible strategy but is useful in determining when to be invested.
If you invested in crypto in 2013, at the peak of the market, you made lots of money if you chose BTC, even though BCA is still lower today. However, if you bought many of the popular tokens of the time, you would have been wiped out as many never recovered.
Hence a cap-weighted index would today show huge gains since 2013, mainly derived from BTC and ETH. In contrast, BCA tells us that using a chimp to throw darts to select tokens was a losing strategy back in 2013. Litecoin (LTC) peaked at $47 in December 2013 and is $122 as I write - hardly an outsized return. Be glad you didn’t own Peercoin, Worldcoin or Feathercoin, which have long since been forgotten.
BCA can help you to understand when the market is strong and therefore when it is more profitable to invest. In the below example, if you owned BTC when the BCA score was above 2/5 and sold when it fell back down to 1/5 or 0/5, you would have done quite well. The reason is simple; you missed the dips.
Trading BTC using BCA
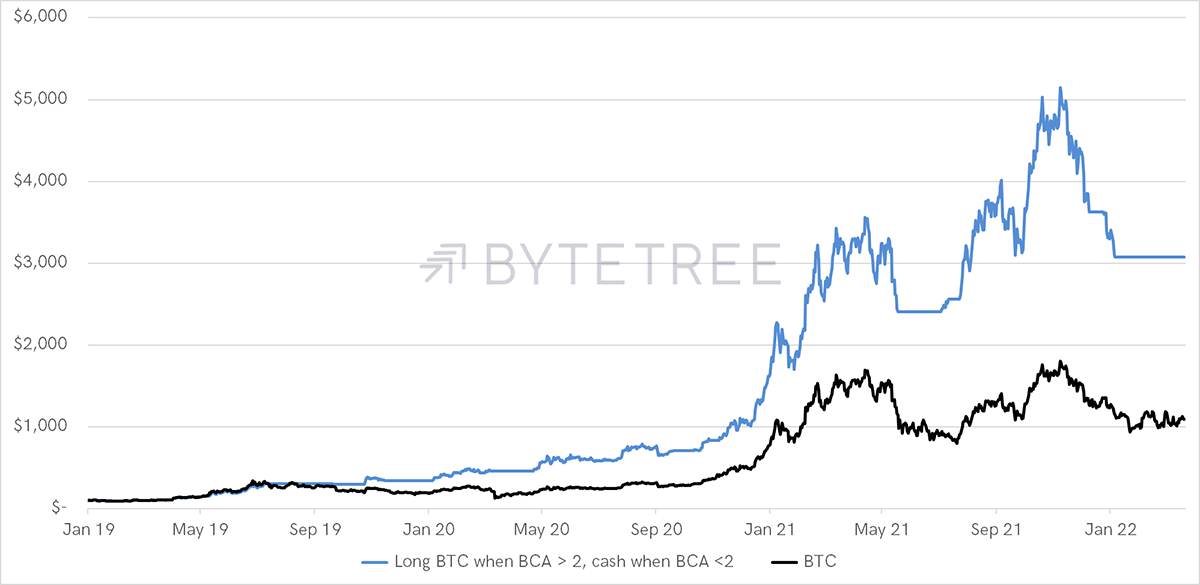
It is noticeable that this simple strategy added much more value in 2019 and 2020 than it has since 2021. That is because this space is maturing, and simple strategies with powerful trading signals are harder to come by.
Yet BCA still adds value, and it deserves its place in a crypto investment strategy because it deals with “what if?”. That is, it has your back during times of weakness and gives you the heads up ahead of impending strength.
Explore ByteTrend on the Terminal or read all articles on ByteTrend.
The ByteTrend Article Series
- Part 1: Introducing ByteTrend: A Trend Following Strategy for Crypto
- Part 2: Finding the Winners in Crypto
- Part 3: The Power of Relative Strength in Crypto
- Part 4: Introducing the ByteTree Crypto Average (BCA)
Comments ()