The Power of Relative Strength in Crypto

Disclaimer: Your capital is at risk. This is not investment advice.
ByteTrend: Part 3
In part 2, I told how Amazon had made 376 new all-time highs since its IPO in 1997 and 375 of them were reminders to own this company. Buying into strength has always been, and always will be, a winning strategy. In part 3, I will demonstrate the power of relative strength, where an asset is compared to its peer group.
Before we get there, I should mention an issue with buying new highs is that they can all come at once. In a bull market, most stocks are rising, so buying all the new highs could see you ending up with a lot of stocks. This is where relative performance kicks in, because you focus on the stocks that are not only making new highs but beating the market as well.
I’ll start at the beginning and work through an example.
Constructing a price relative chart
Relative performance compares the performance of two assets. In the stockmarket, the convention is to compare a company to the overall market. In this example, I’ll use Amazon (again) and the S&P 500. The two price lines are displayed on the chart, and on the face of it, they appear to be similar.
Amazon and the market
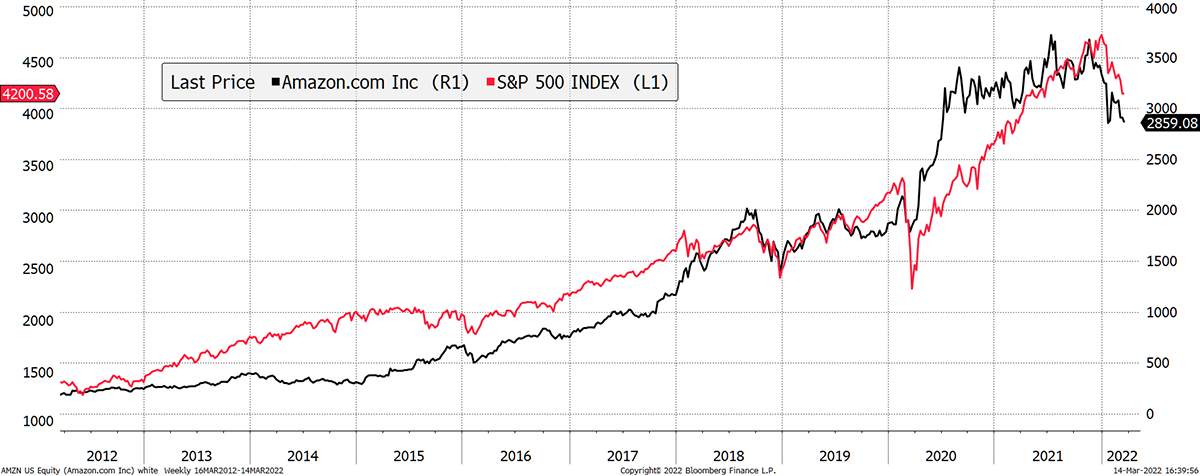
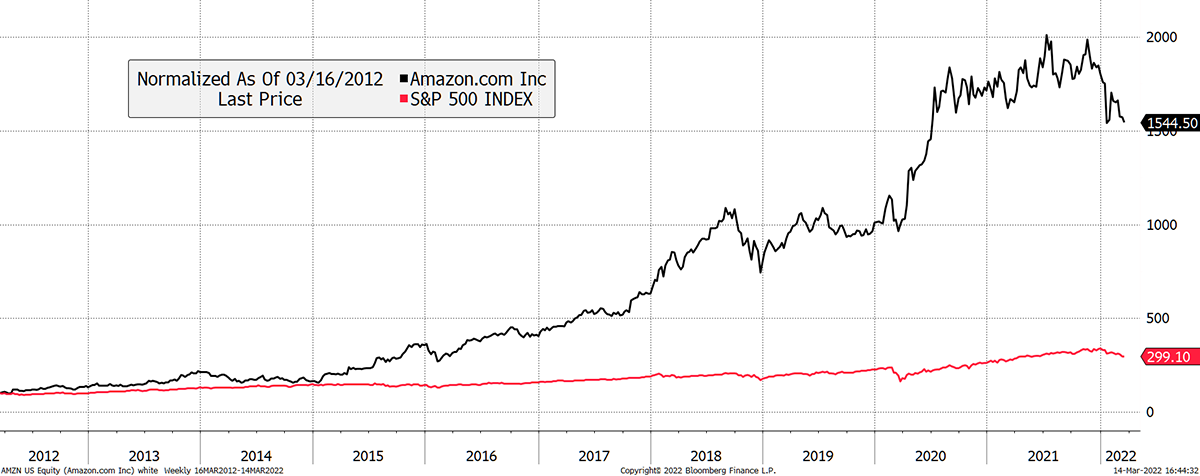
The trained eye will have spotted different axes for these two lines. It turns out they are very different as the S&P 500 rose 3-fold, while Amazon rose 15-fold. By rebasing the chart to 100, the performance difference becomes clear. Amazon has turned $100 into $1,544, while the S&P 500 has only managed $299.
Amazon and the market starting from $100
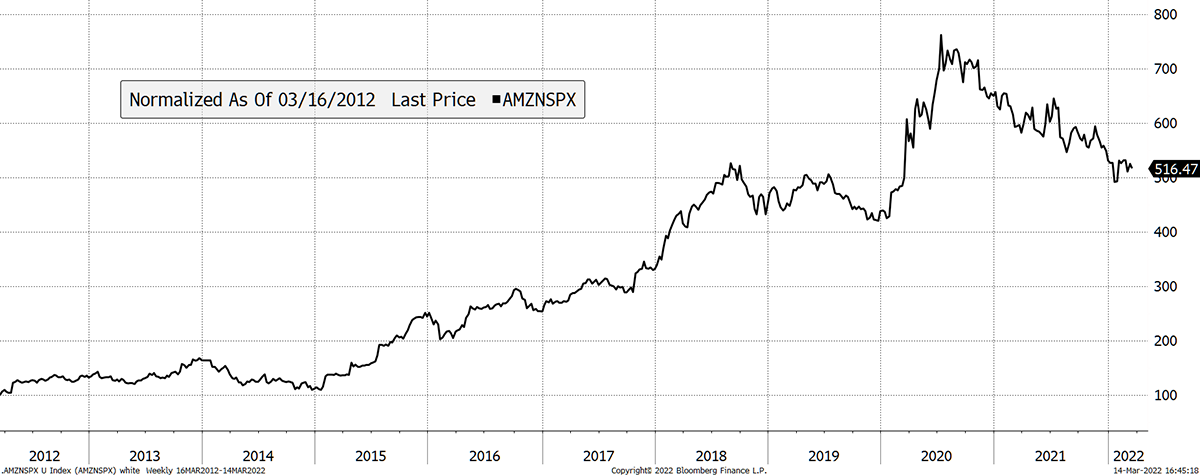
The next chart compares the two lines above by dividing Amazon by the S&P 500 and rebasing to a starting value of 100. The single line now shows the excess return of Amazon over the S&P 500. When this line is rising, Amazon is beating the market. When sideways, it is the same, and when falling, Amazon is lagging the market. Amazon has performed 4x better than the market over the past decade but has lagged over the past 18 months.
Amazon relative to the S&P 500
The final stage is to overlay the ByteTrend process onto the line shown above. Using the scoring system, the state of the trend can be expressed by a single digit ranging from 0, weak to 5, strong. Think of this as a framework.
Amazon relative to the S&P 500 overlaid with ByteTrend
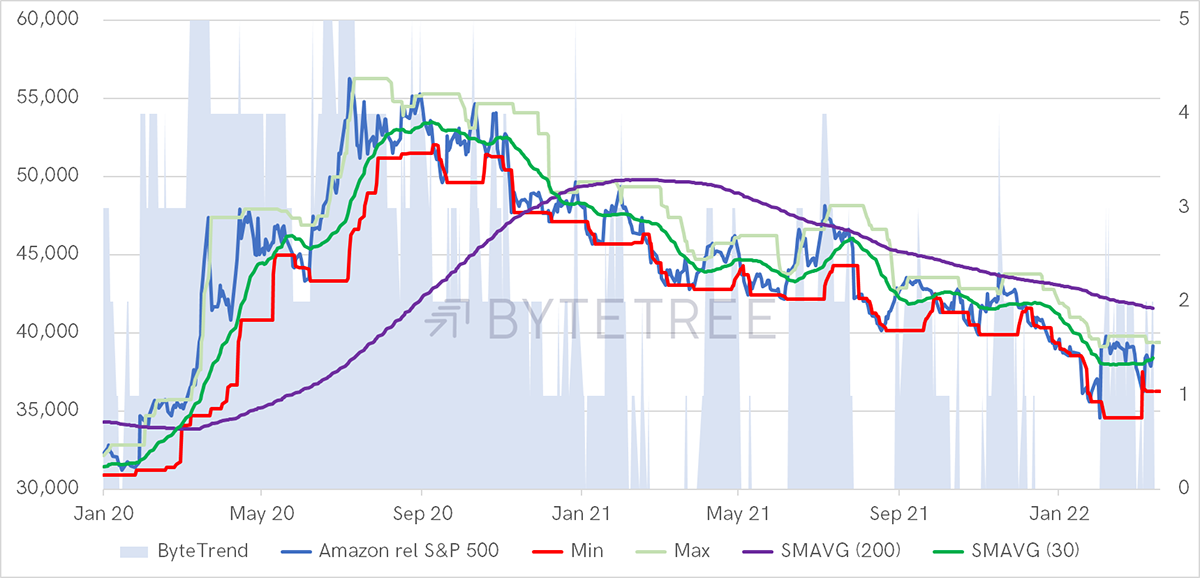
Traditionally, technical analysis required a human eye to interpret the trend and express a view. ByteTrend removes that discretion and expresses an unbiased and factual view.
I have used the stockmarket to explain the ground rules and will now apply the same to crypto.
ByteTrend in crypto
The next chart shows ETH priced in BTC with the ByteTrend overlay. The score was generally low in 2019, which means ETH was lagging BTC. The price was generally strong from mid-2020. It has recently cooled.
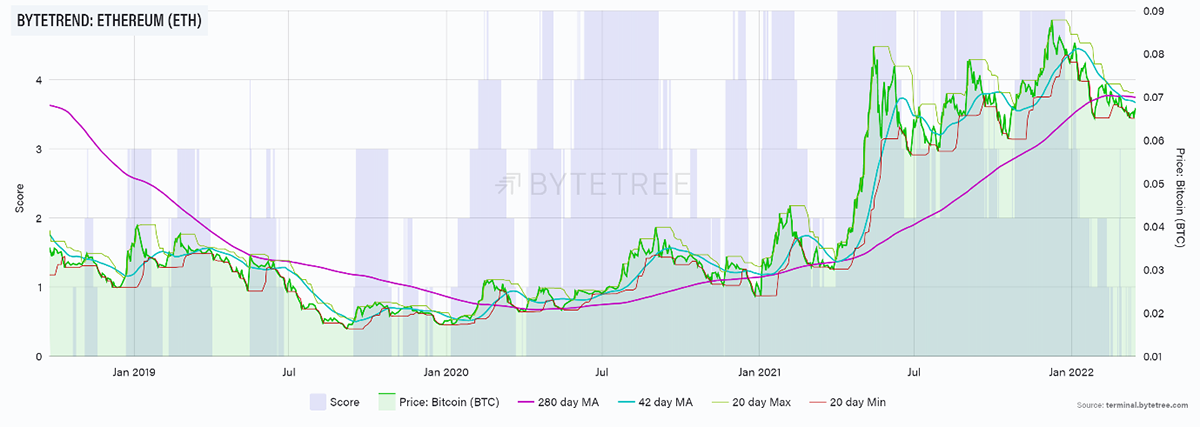
The ByteTrend scores can be applied to ETH in BTC in a number of different ways, depending on the objective. An investor who appreciates ETH, but is a long term holder of BTC, might use this chart to decide when to swap some BTC for ETH.
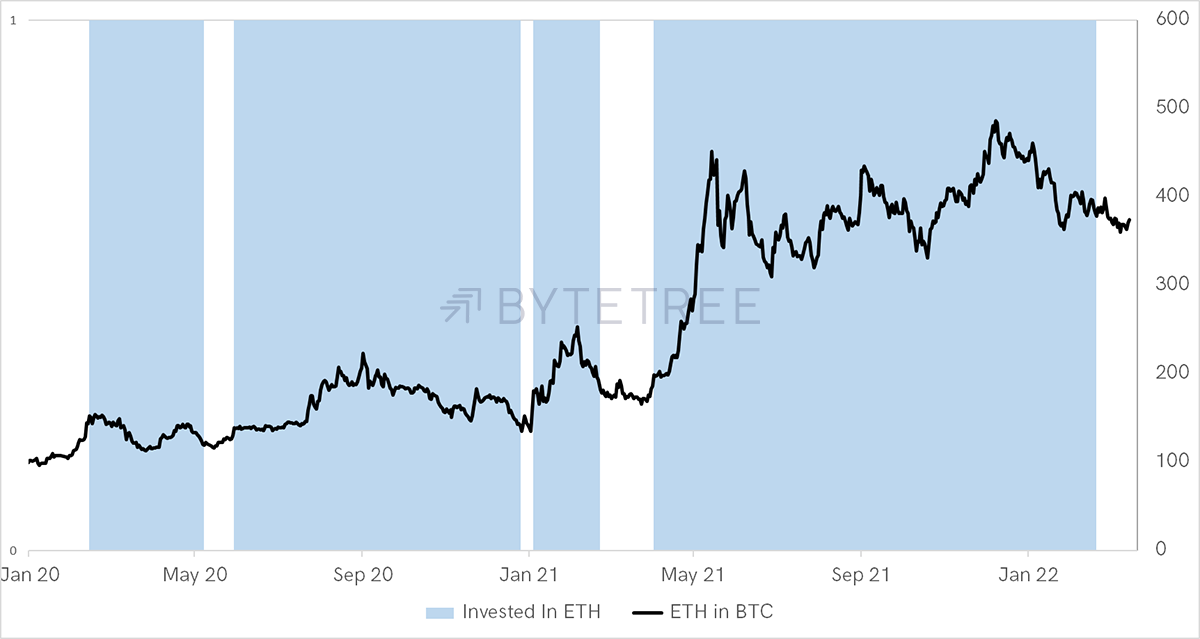
A slow strategy might switch BTC to ETH when ETH ByteTrend shows a 5/5 and switch back when it is a 0/5. This would be a low turnover approach as the signals are infrequent. The strategy would capture the big up moves in ETH and aim to ride out the storm until the trend has truly turned negative. Since 1st Jan 2020, there have been four signals, and the strategy resulted in 47% outperformance over just holding BTC. For reference, BTC was a 6x trade since early 2020.
ETH in BTC Buy 5/5, sell 0/5
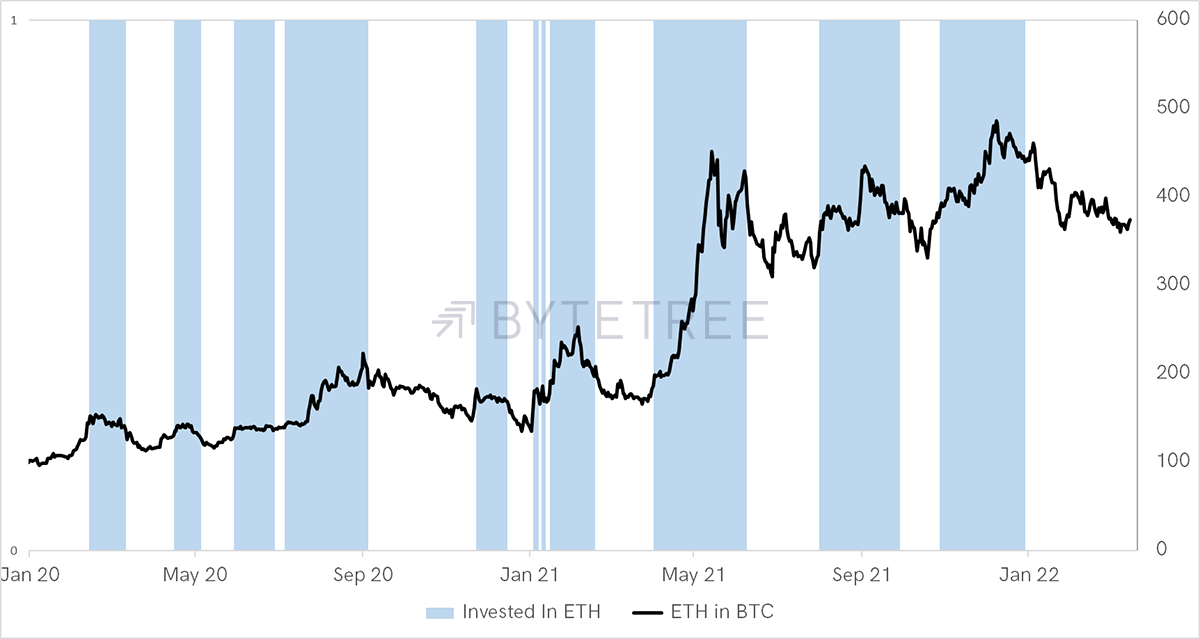
An investor might conclude that they would be happy to trade more frequently if the result locked in more profit. In this example, the rule buys when ETH in BTC scores 5/5 and sells when the score drops to 2/5 or below. This leads to a very respectable 86% excess return, but the turnover has risen.
ETH in BTC Buy 5/5, sell 2/5
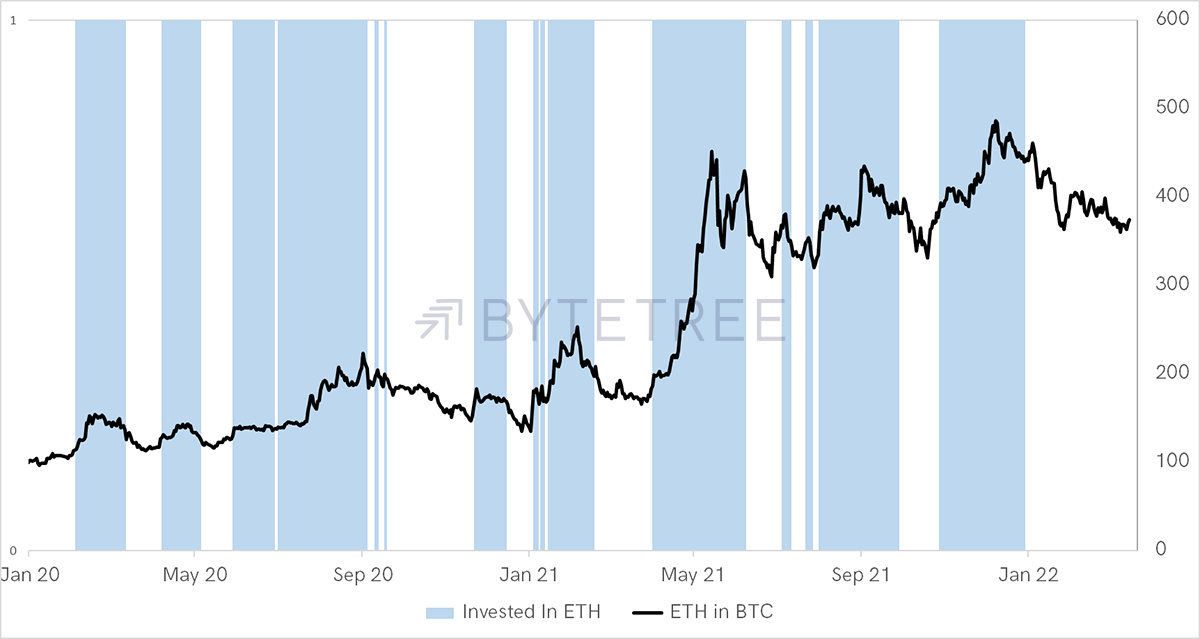
A more aggressive approach might buy 4/5, in anticipation of a 5/5 coming later. In these results shown, I have taken the next day’s price move, and so in anticipating breakouts, you might reap the rewards. If the strategy then remained long while the number was a 3, 4 or 5/5 only to sell a 2/5 or lower, then the results delivered a stunning 209% excess return. In this instance, anticipating the breakout has been right.
ETH in BTC Buy 4/5, sell 2/5
Capital Preservation
There are no limits to what can be explored. The reason for trend following isn’t just the possibility of excess return, it is also capital preservation.
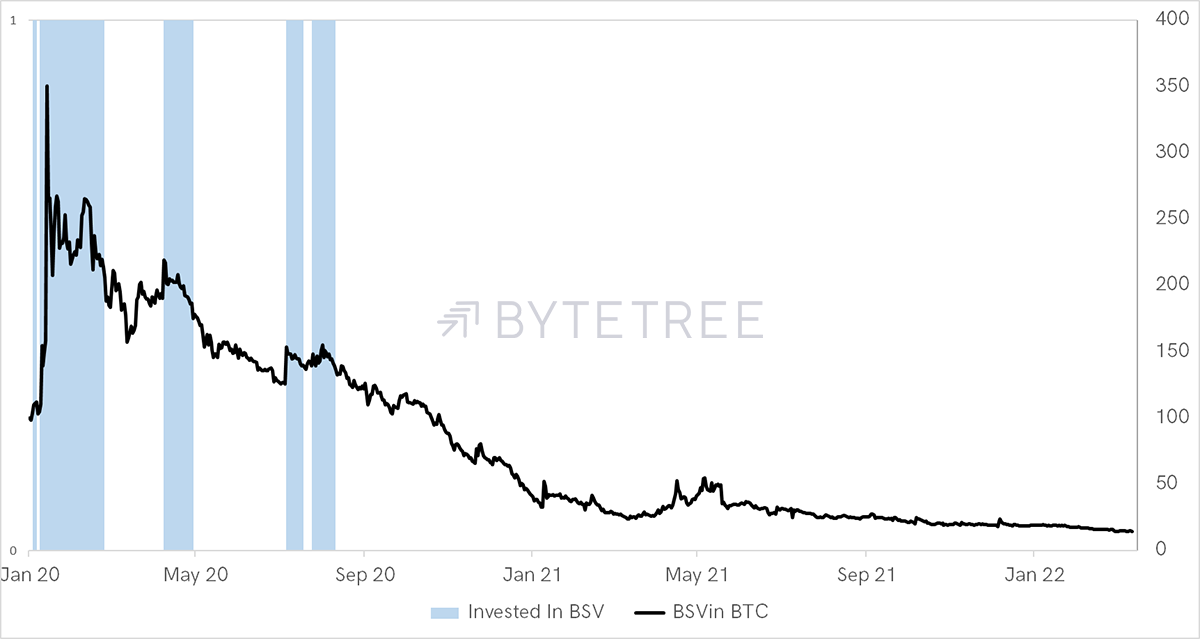
Imagine we were trading BSV, a bitcoin fork that has failed miserably. Over the past 2+ years, BSV has lagged BTC by 85%. Using the trend following system above hasn’t triggered a buy since the summer of 2020. Better still, this same strategy even managed a modest excess return of 18%.
BSV in ETH Buy 4/5, sell 2/5
Summary
Part 3 looks at asset prices relative to their market or peer group. In crypto, there is no credible S&P 500 equivalent, and so we just use BTC, which is the most stable and liquid instrument in the space.
I have shown how a relative line displays excess return, and by overlaying the ByteTree trend following framework, there is an unbiased interpretation of the data. A rules-based trading system can then deliver actionable signals.
You don’t have to use ByteTrend on a single asset but observe the daily changes in a larger universe. This highlights more opportunities. By seeking strength and avoiding weakness, you end up in the good stuff, and it wasn’t luck that got you there.
Explore ByteTrend on the Terminal.
The ByteTrend Article Series
- Part 1: Introducing ByteTrend: A Trend Following Strategy for Crypto
- Part 2: Finding the Winners in Crypto
- Part 3: The Power of Relative Strength in Crypto
- Part 4: Introducing the ByteTree Crypto Average (BCA)
Comments ()