The Canary in the Coalmine

Disclaimer: Your capital is at risk. This is not investment advice.
Bitcoin’s crash should be seen as a warning for the stockmarket.
The recent crash in bitcoin was triggered by the US inflation data on Friday, which came in at 8.6%. The world laughs at the unwinding of the great Ponzi scheme, but which one are they referring to?
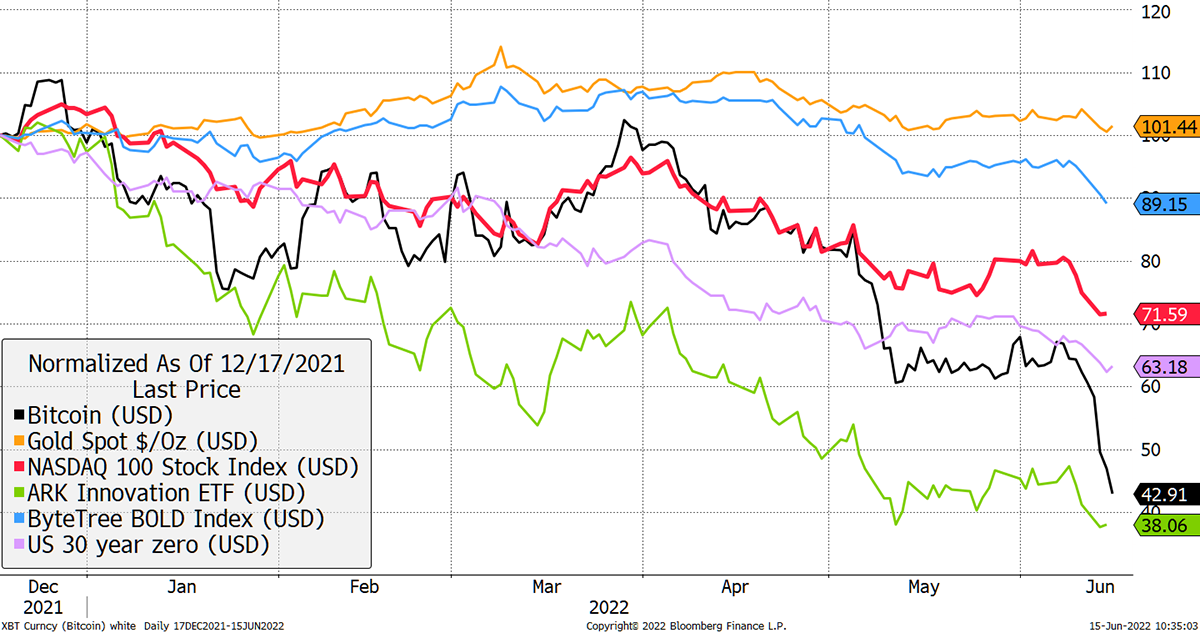
Over the past six months, the long bond (a 30-year zero coupon US treasury) has seen $100 turn into $63. In recent days, bitcoin has slumped down to the levels of the non-profitable tech stocks. Indeed, until a month ago, bitcoin had been no worse than the NASDAQ, and before that, the long bond.
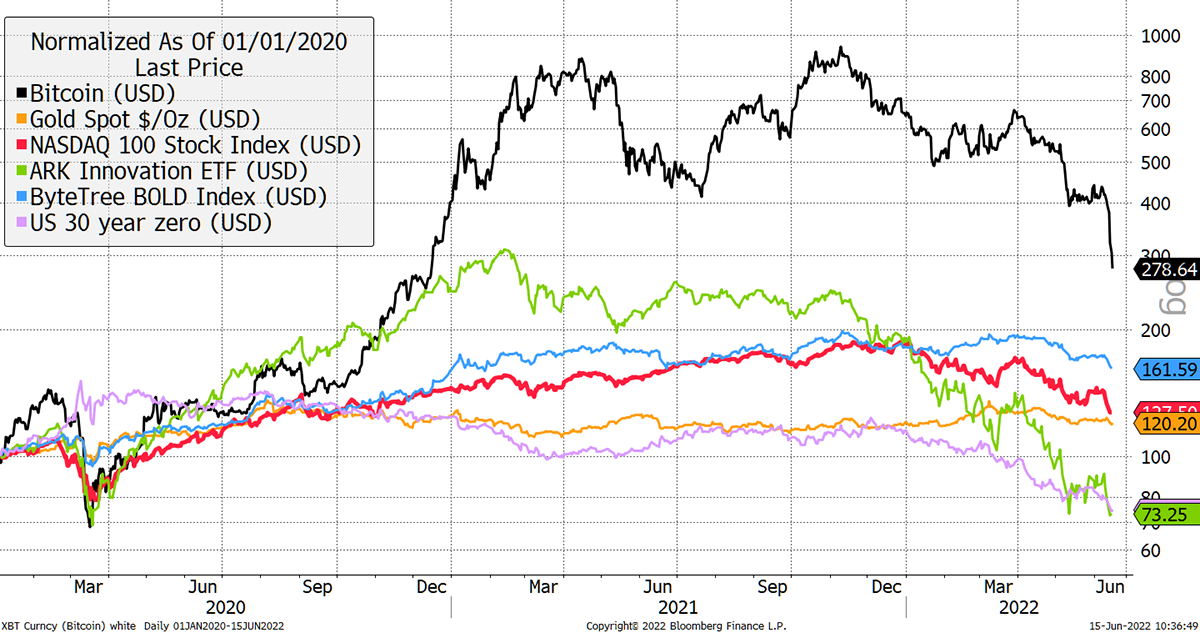
A rough six months for asset prices
For balance, I have shown this same chart over 5 years, 4.5 years (bitcoin 2017 peak), and since life pre-covid (1 January 2022) at the end of this piece.
The point worth highlighting is that bitcoin is a pure risk asset and has tended to be a leading indicator for risk assets in general. Bitcoin weakness has forewarned of broader weakness in equities in Q4 2018 and March 2020. I believe that the recent bitcoin plunge should be seen as the canary in the coalmine.
Looking at bonds and equities (TradFi in crypto speak – traditional finance) over 4 decades, the capital return of a hypothetical 30-year zero-coupon bond and the S&P 500 have been aligned.
Normally, you would expect bonds and equities to be counter-cyclical, with the asset classes working against one another. The 2000 dotcom bubble saw bonds shunned as equities surged, only for that to reverse in the equity bear market that followed.
Equities and bonds are supposed to be counter-cyclical asset classes
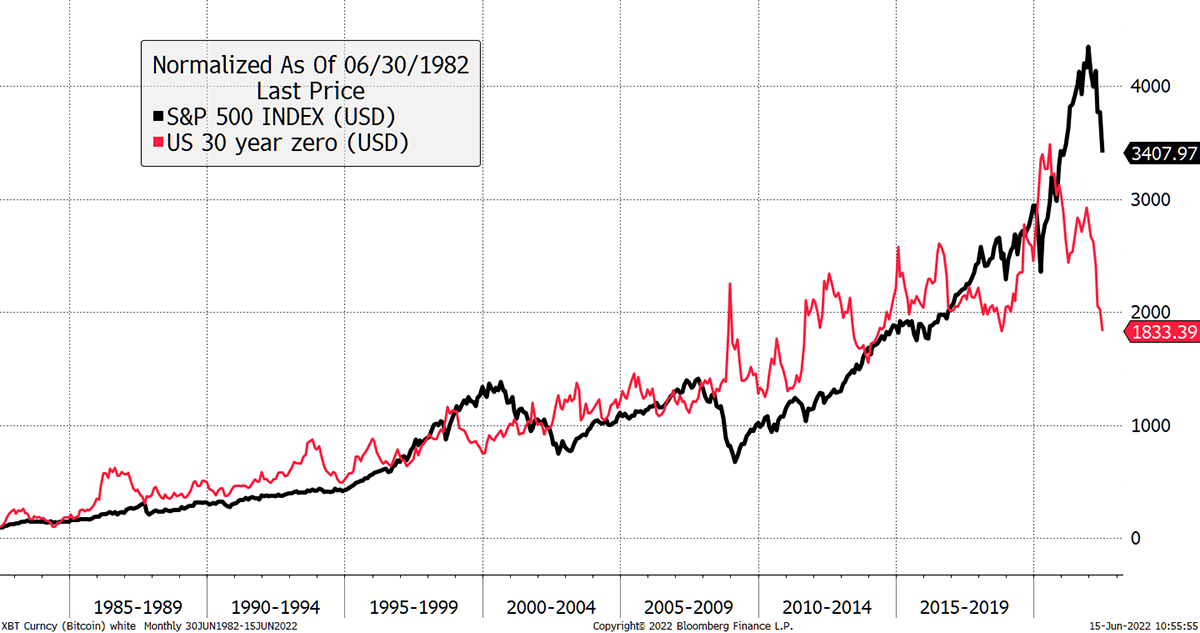
There were other examples, such as the 2008 credit crisis and the Covid crisis, where bonds soared while equities tanked.
The chart above can be expressed as a relative chart showing equities versus bonds, shown below. The remarkable thing is how the equity bond relationship has tended to mean revert over 40 years.
The Everything Bubble
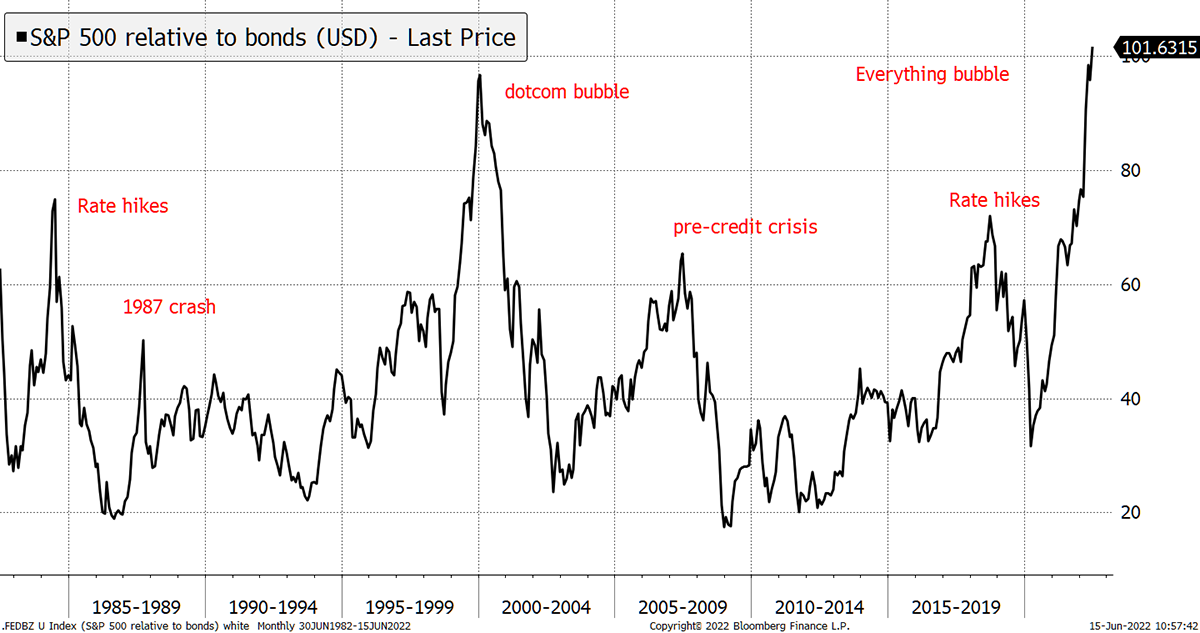
The scary bit is how this chart has gone even higher than ever. That is because equities (S&P 500) have fallen by less than the long bond so far this year. As a result, equities are now more stretched against bonds than at any time over the past 40 years.
This reflects the Fed’s determination to hike rates to combat runaway inflation. That means interest rates could rise significantly from here.
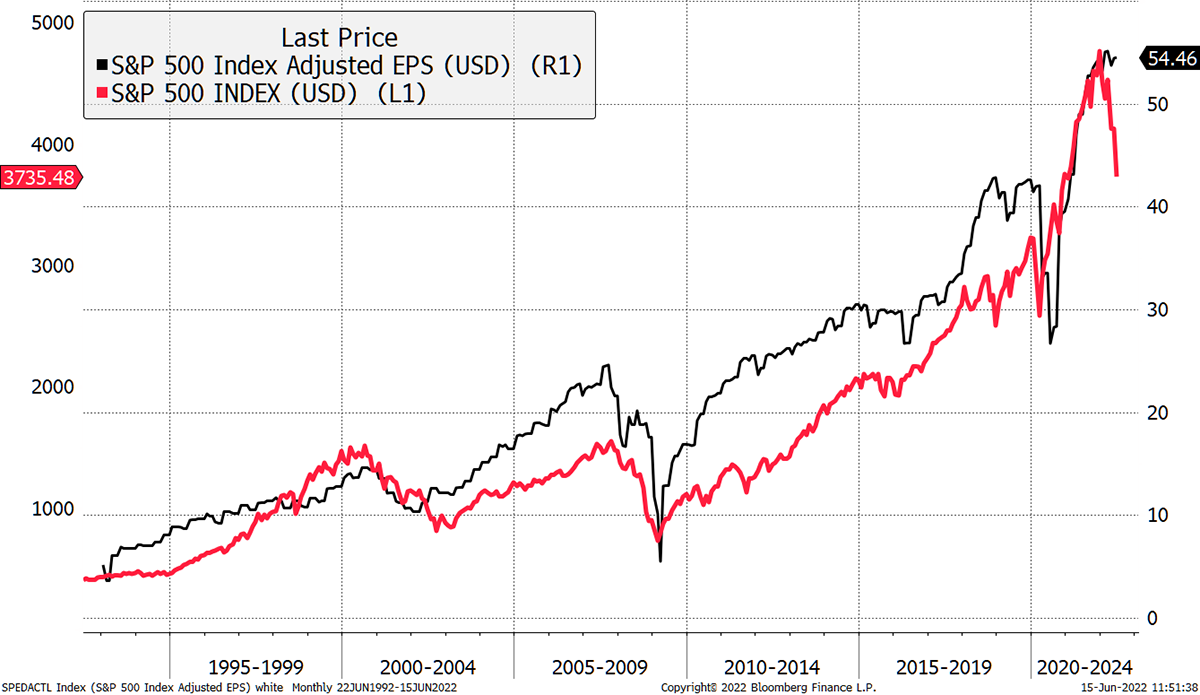
Yet the stockmarket ignores this truly historic signal because, for some obscure reason, the earnings forecasts remain resilient.
Stockmarkets have many drivers, but the most important driver of direction has been profits, and, for long-term returns, valuation. The market is telling us that profits are soon to nosedive, and that valuations are so stretched that the next few years could be horrendous for financial assets.
Earnings forecasts yet to reflect the inevitable slowdown
Summary
Bitcoin is an alternative asset which is volatile, cyclical and risky. Yet that volatility (70%) remains below the levels seen in past crashes such as 2014 (150%) and 2018 (90%).
Furthermore, the bitcoin network, which transfers value around the world to the tune of $40bn per week, remains resilient, in notable contrast to past bear markets when transaction value has collapsed.
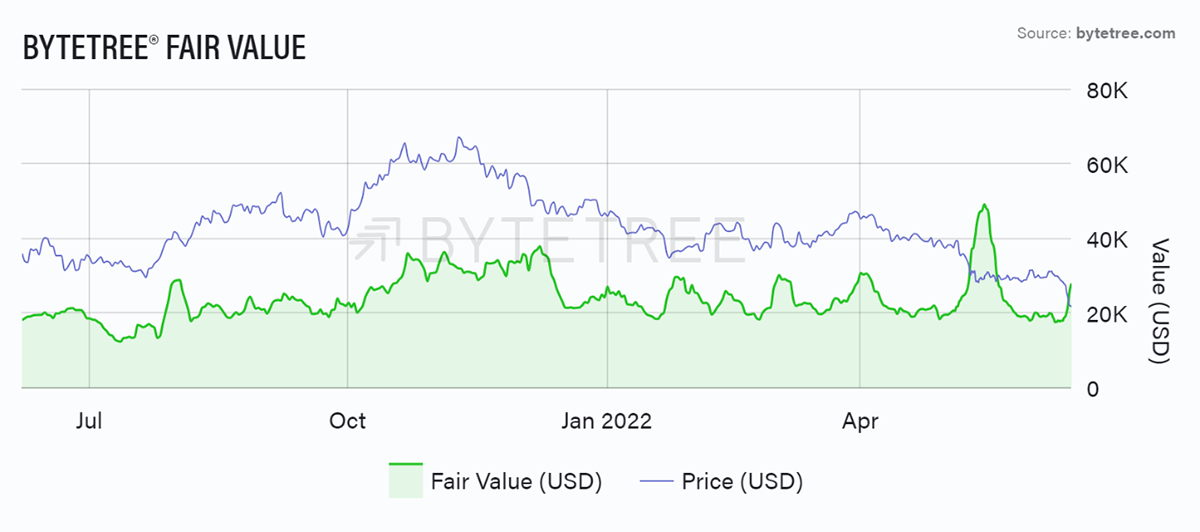
Bitcoin may well be another victim of the everything bubble, but at least on ByteTree metrics, it is already trading within value territory (see below).
Bitcoin has suffered from a dearth of liquidity caused by the Fed’s policies. Those in TradFi, who don’t want to engage with bitcoin, should heed the message. The everything bubble is unwinding, and it’s not over until it’s over.
Today, bitcoin leads markets down, but when this is behind us, it will once again lead them higher.
Bonus Charts
Since Pre-Covid
Past five years
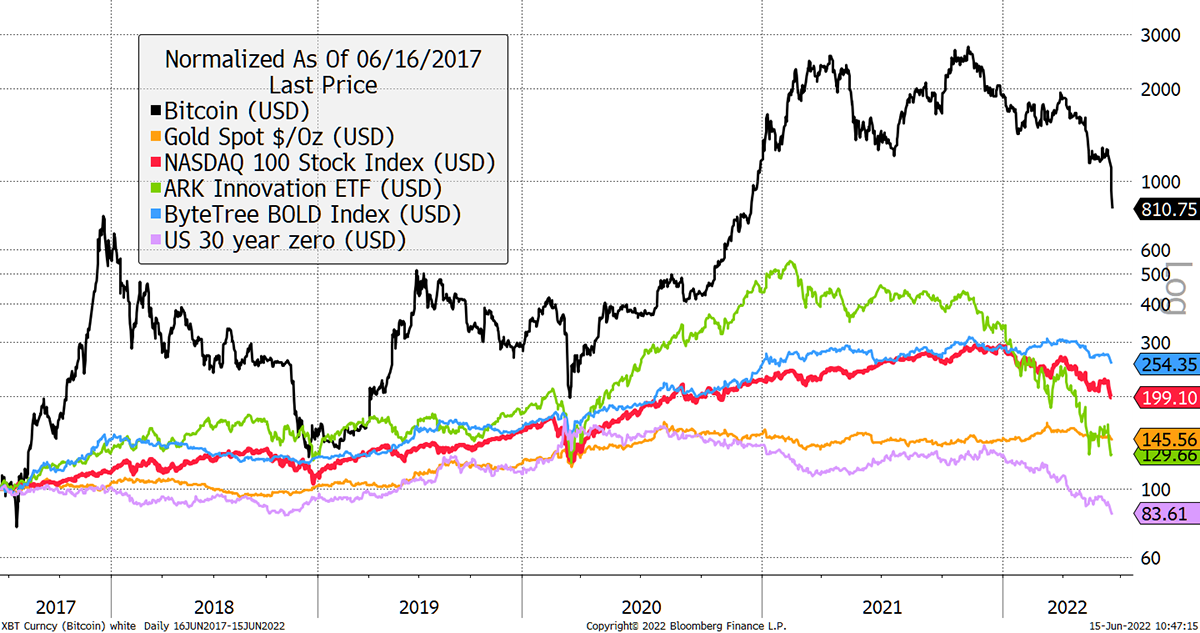
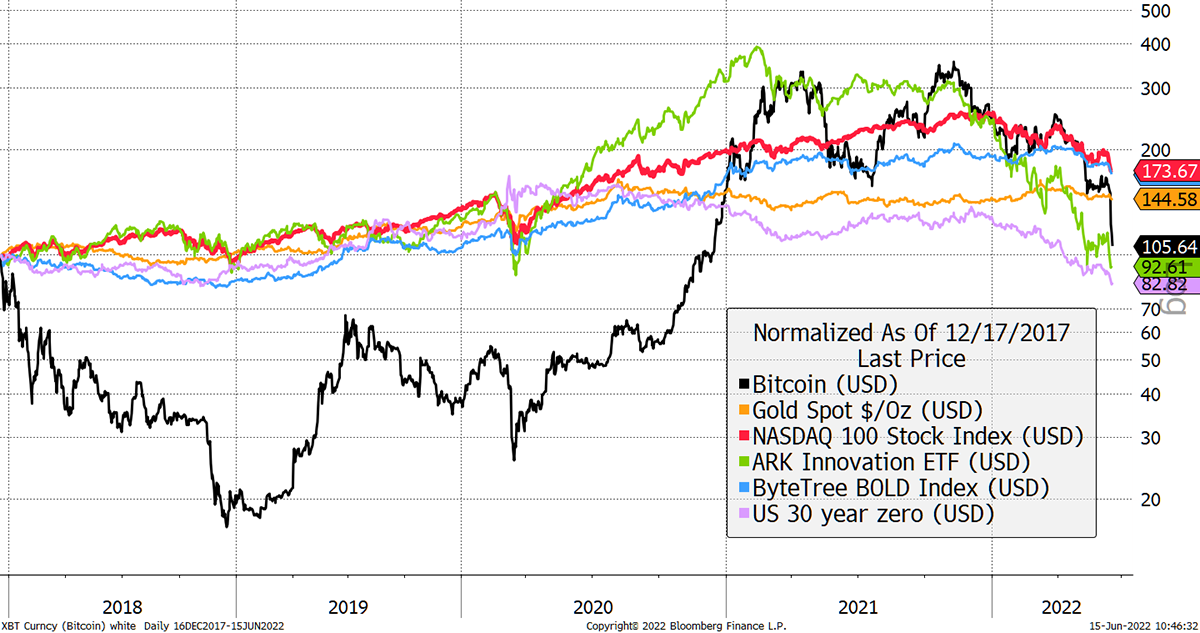
Since the 2017 bitcoin peak
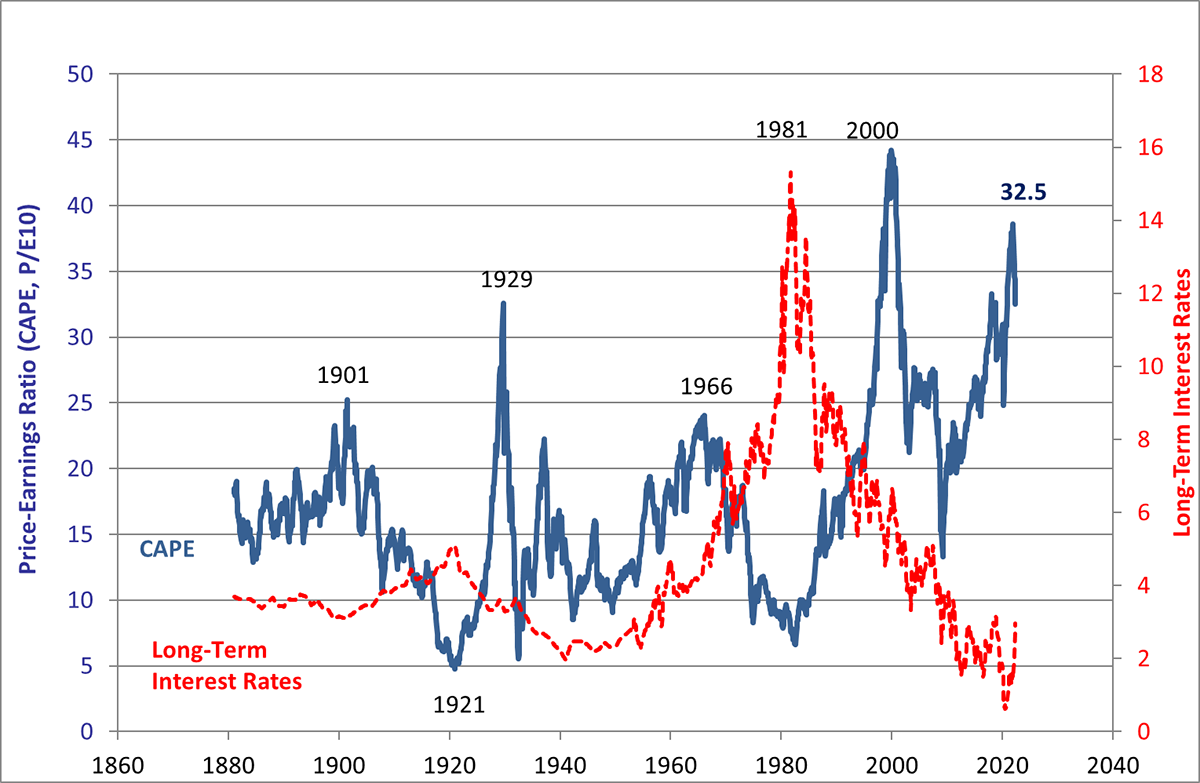
Shiller CAPE PE
Bitcoin - ByteTree Fair Value past year