

Atlas Pulse Gold Report - Issue 76;
As a multi-asset fund manager by trade, I wanted to know the times you need to own gold and those you don’t. Through luck or judgement, the track record over ten years has been excellent.
Highlights
| Macro | Dollar valuation screams bubble |
| Valuation | Gold is 20% overvalued, but fortunately bonds are wrong |
| Regime | Reiterating bull market |
| Flows | Let’s not forget China |
Macro
The recent slump in the pound was accompanied by a slump in the Yen, Swedish Krona, the Euro, and others. There was even a slump in gold when measured in dollar terms. There comes a time when you ask the question; maybe it’s the dollar?
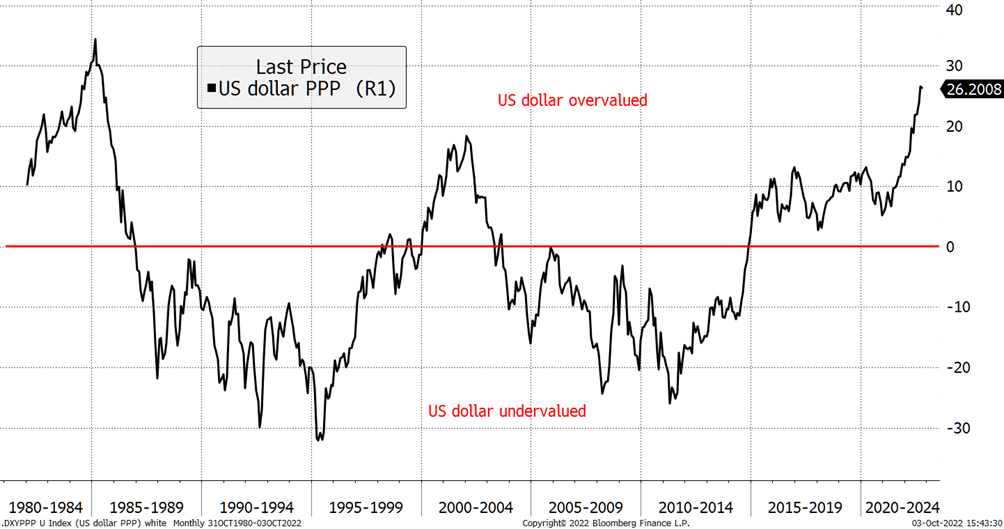
Using purchasing power parity (long-term inflation differentials), I have valued the dollar on a weighted basis against the JPY, EUR, GBP, SEK, NOK, CHF, AUD and CAD. The dollar trades at a premium to all of them, the smallest being CHF at 3% and the largest, JPY at 48%.
The result is that the US dollar is 26% overvalued against a global basket of developed currencies. That beats 19% in late 2001 but lags the 34% premium logged in 1985. As US exporters lobbied for a weaker dollar, this led to the Plaza Accord, which brought down the value of the dollar through currency intervention.
In the end, there wasn’t much intervention. The overvaluation of the dollar caused US CPI to collapse. US interest rates generally fell faster than elsewhere, and the dollar duly fell. By 1995, the dollar was dirt cheap.
The Dollar Is in a Bubble
It struck me that perhaps dollar valuation would impact gold. It turns out that it does, and by much more than the move in the exchange rate. In the chart below, I have highlighted the dollar highs to lows from the chart above with the gold price overlaid.
Gold Likes a Falling Dollar
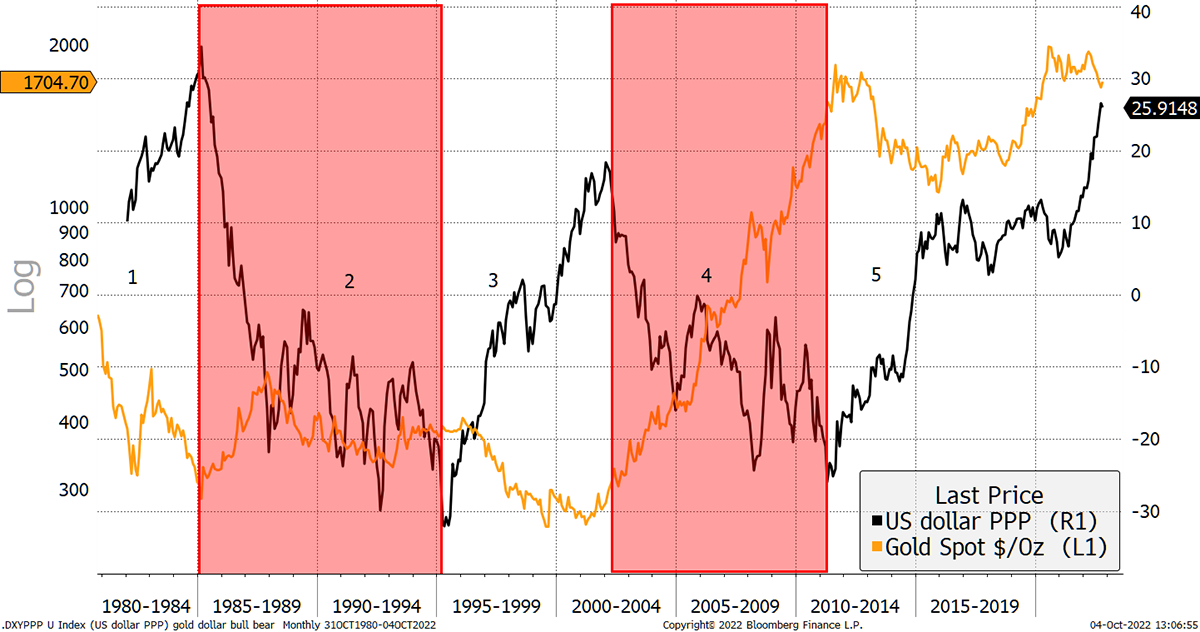
It is clear that gold likes the dollar to fall and vice versa, yet these moves can far exceed the inverse of the dollar move. In dollar bull markets, gold has been weak, and in bear markets, gold has been strong.
| Period | Gold Return | Dollar |
| 1 | -52% | Bull |
| 2 | 28% | Bear |
| 3 | -23% | Bull |
| 4 | 418% | Bear |
| 5 | 9% | Bull |
In period 2, you might say that a 28% gain isn’t much, but given real interest rates averaged 2.5% over the 10-year period, a positive return was a result. Normally speaking, positive real rates that high would cause gold to be crushed.
The point is that in my first decade writing Atlas Pulse, the dollar has been strong. Now it is massively overvalued, and we can look forward to a weaker dollar over the next decade. This will provide tailwinds for gold and is a good time to reiterate my forecast of $7,000 by 2030. That was published in LBMA’s Alchemist back in 2020.
Valuation
There is just one small problem: gold’s valuation also seems to be high according to my model. Gold is now on a 23% premium to fair value, which is below $1,400.
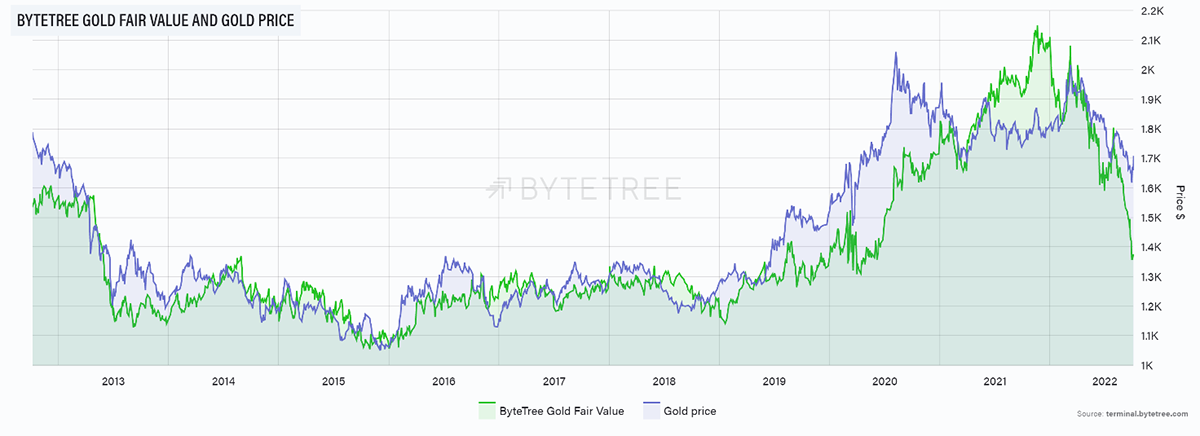
Remarkably, I have not changed the model since 2013, and the price and fair value have seen an R squared of 0.86, which is an excellent fit. More to the point, this has been the most accurate gold valuation model in the world, and unlike most gold valuation models, the gold price is not even an input.
Valuation is all about the margin of safety. It is useful for analysing risk in the short-term and for estimating returns over the long term. Put simply, gold bought cheaply will deliver higher returns than gold bought at a premium. It’s as simple as that.
With gold in dollars, we have gold that is slightly overvalued (bad for gold), yet so is the dollar (good for gold). Might they cancel each other out?
I have added the gold premium with the dollar discount. In 2001, gold was undervalued while the dollar was overvalued. On that basis, gold in 2001 was 70% undervalued and very bullish for gold. No wonder the next decade turned out so well.
Gold Risk – the Gold Premium Plus the Dollar Discount Highlights Maximum Risk
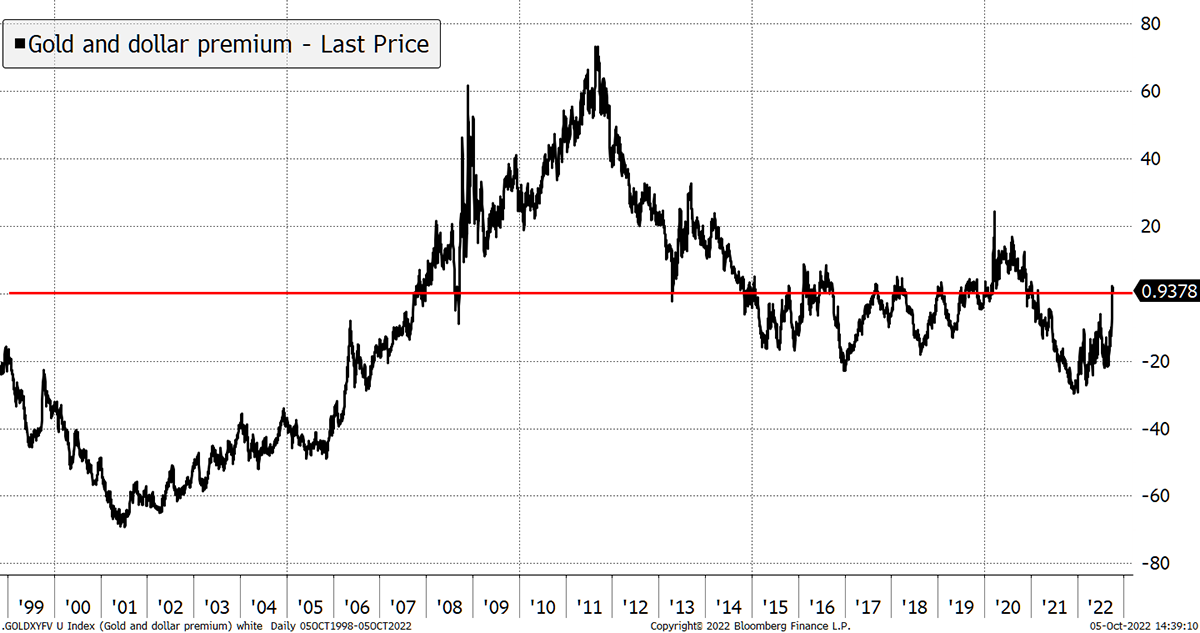
Then in 2011, the dollar was undervalued while gold was overvalued. That showed how gold was firmly in bubble territory and at risk. Today, with both the dollar and gold overvalued at the same time, they cancel each other out. In dollar terms, at least, gold is fine.
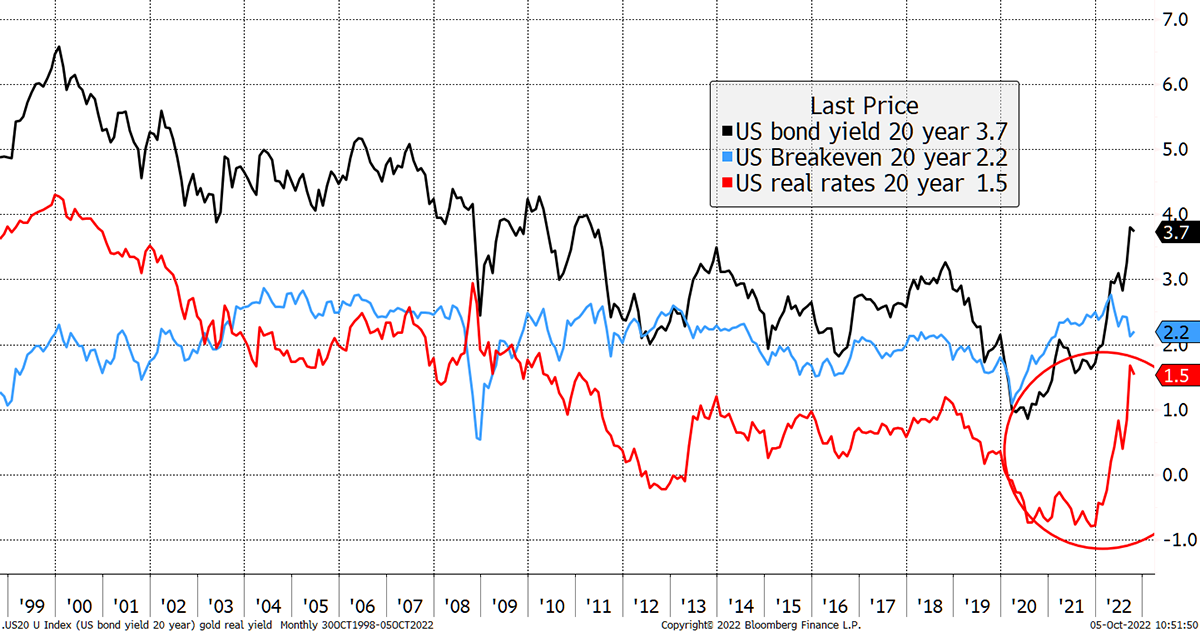
But the reason gold has jumped to a premium is currently the same as why the dollar has jumped to a premium. Real interest rates have surged under General Jay’s (Powell) assault on markets as he tries to recreate his version of 2008.
Rising interest rates have led to rising 20-year bond yields (gold’s sweet spot black line). That has coincided with lower expected inflation (blue), in line with softer commodities. This higher rate/ lower inflation combination has caused real rates (red) to surge. It has been an almighty move. When real rates ballooned in 2013, gold collapsed, so it’s not unreasonable that gold is down in dollar terms this year and remains under pressure.
General Jay’s Assault
Despite the current consensus that the end of the financial world is nigh, and therefore gold must surge, there is a risk that the Fed follows through with the return to tight money, and gold falls to fair value.
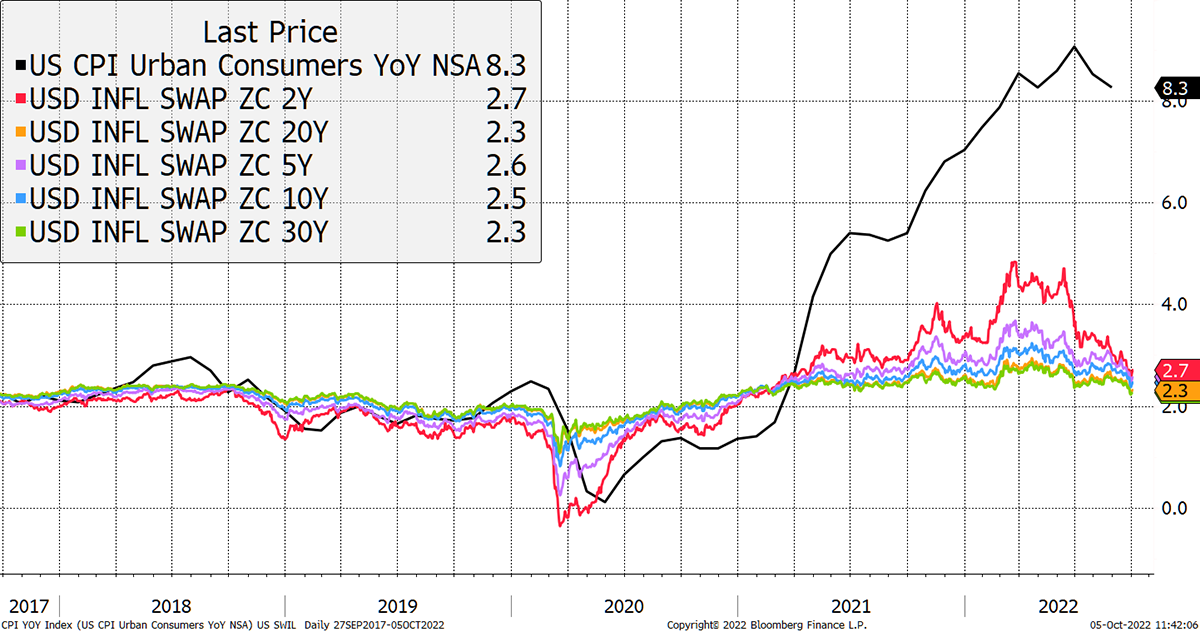
There is an alternative explanation that the bond market is wrong. Regular readers also know my disdain for expected inflation derived from bond markets. I accept that expected inflation has cooled, with commodities etc., but not by this much.
Does inflation really collapse from 8.3% to 2.7% over the next two years? Probably not. In which case, my valuation model is understating fair value, and I will be delighted if that is true.
Imaginary Inflation Expectations
You’d think the clever people buying Treasury Inflation Protected Securities (TIPS) by the boatload would have thought about future inflation. Not according to a paper by J. Gagnon and M. Sarsenbayev at the Peterson Institute.
Hat tip to James Ferguson from the Macro Strategy Partnership for highlighting this important point. The paper adds academic gravitas to what we have been thinking; that bond markets are not good predictors of inflation.
The paper shows how a 10-year average of past inflation is the best predictor for US yields. It appears that bond markets agree with Winston Churchill’s dictum, “The further back I look, the further forward I can see”.
Ferguson published this chart showing the 10-year gilt yield with 10-year average RPI + 2%. Magically, this seems to forecast the 10-year gilt yield quite accurately much of the time. More striking is how out of whack it has been since 2010.
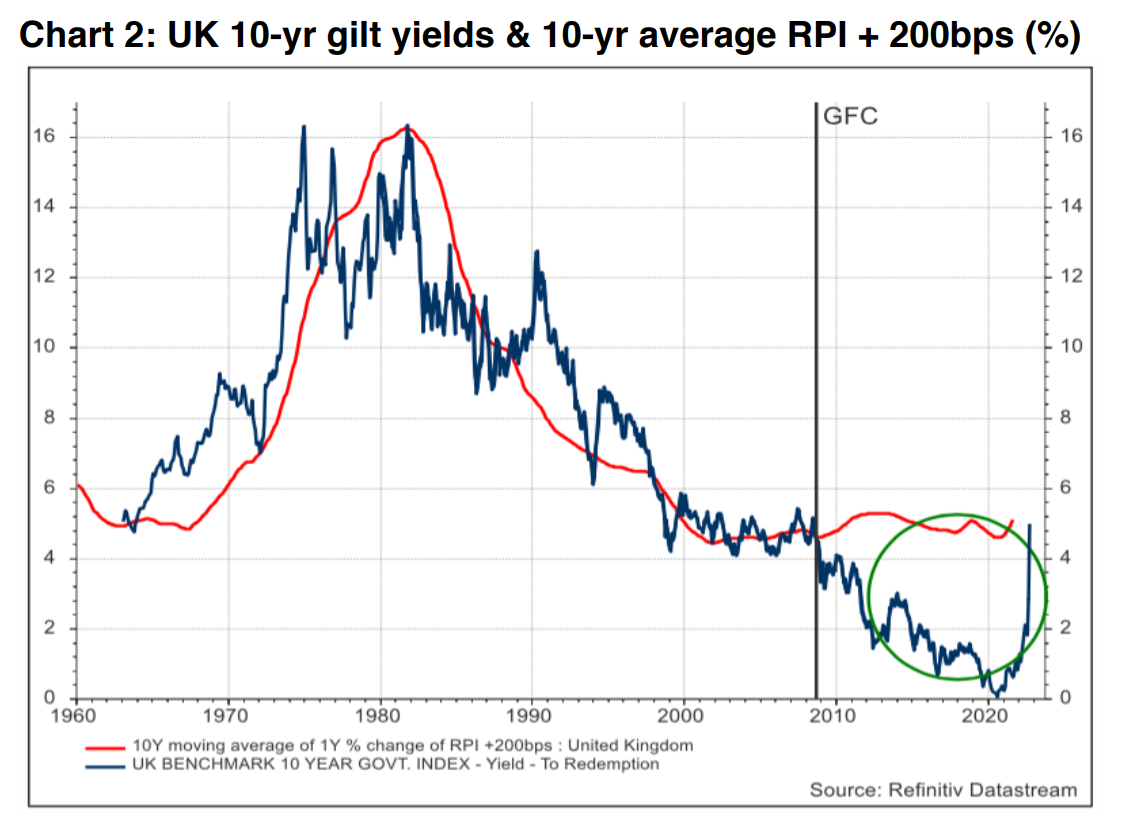
My valuation model highlights a risk that if inflation comes back towards 2%, then gold is overvalued. But maybe those inflation expectations are driven by past experience rather than any sense of what may lie over the horizon. In which case, gold is well supported and may even be undervalued.
Inflation expectations cannot ignore reality forever. If CPI keeps printing high single digits, at some point, gold will explode to the upside.
Regime - Reiterating Bull Market
At times like these, best to check in. Historically gold has been a buy when two or more of the following have held true:
- Short-term real interest rates are below 1.8%. TRUE
- The gold price, measured in a basket of currencies is rising, measured by a 35-month exponential moving average. TRUE
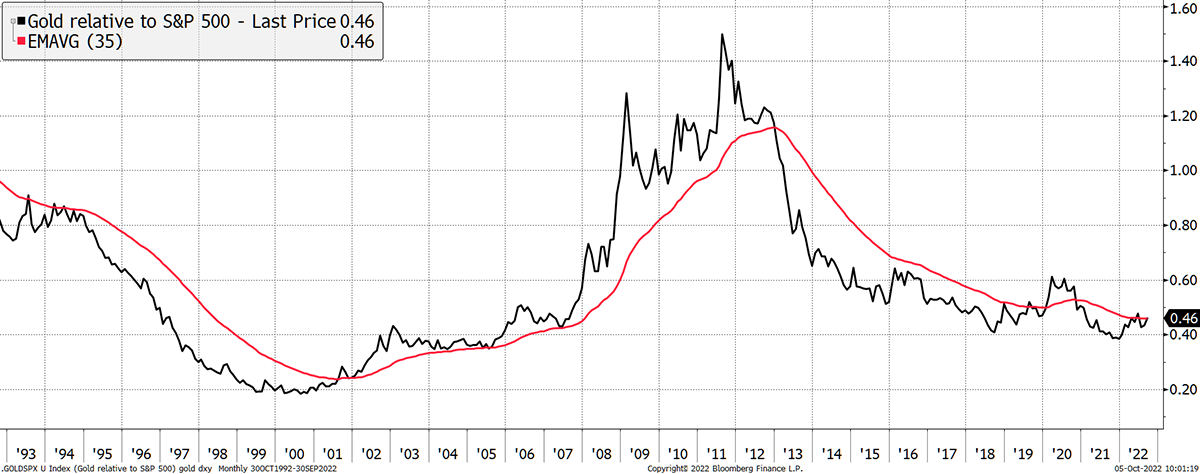
- The gold price relative to the S&P 500, measured by a 35-month exponential. TRUE (finally)
Regular readers will know how frustrated I have become around point 3. It is important that gold is beating the stock market because that attracts inflows. In recent months, money has been leaving the gold market at speed, reversing all the inflows seen in 2022.
Investors Still Dumping Gold
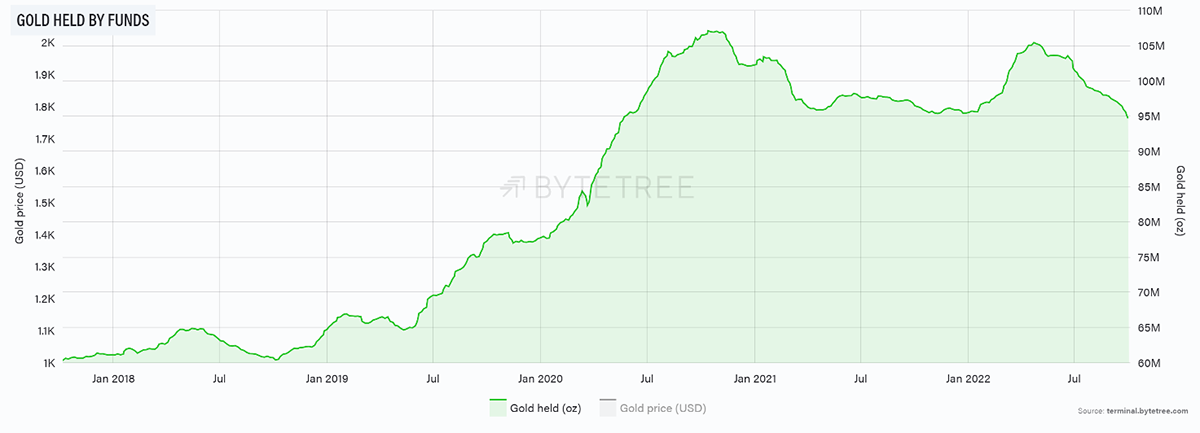
As I said, when gold is beating the stockmarket, there is no need to sell. And when it leads the market, investors had better hurry up and buy.
The gold price is beating the S&P 500 as defined by the slope of the 35-month moving average turning positive. High time!
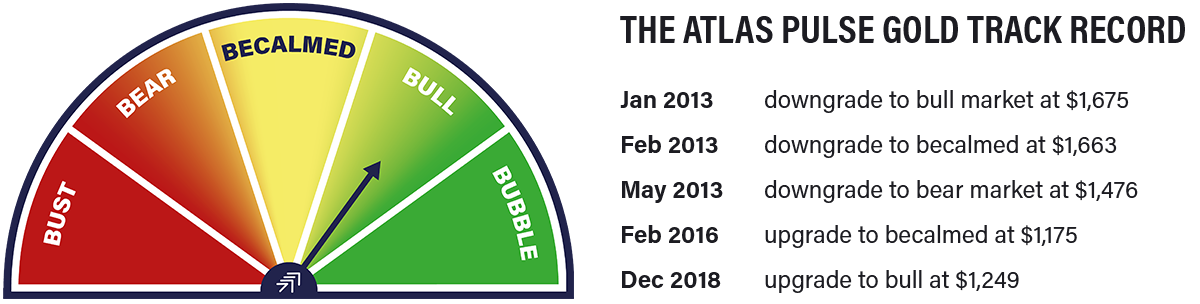
I came up with this idea over a decade ago, and this simple test reduced noise in what can be a volatile relationship. In early 2013, it was instrumental in downgrading gold from bull to bear market.
Gold Leading Equities in 2022
With gold down 6% this year and the S&P 500 down 20%, you’d think asset allocators would come flocking to gold, yet instead, they keep on buying treasuries. Where do they find these people?
Let’s Not Forget China
Here is another of my old favourites that just made it into the Atlas Pulse Bumper 10-year special. That’s thanks to a chance call this morning with James Bennett, my former colleague who is on the cusp of being a major player in the gold market. I’ll spill the beans when he’s ready. James mentioned Chinese demand, and he’s right.
The blue line measures the Shanghai premium (inverted), whereby gold trades at a higher price in China than in London. When that happens, the Chinese buy gold by the truckload. Currently, the 30-day moving average is at -1.6%, which means gold is cheaper in London than in China.
Chinese Gold Demand
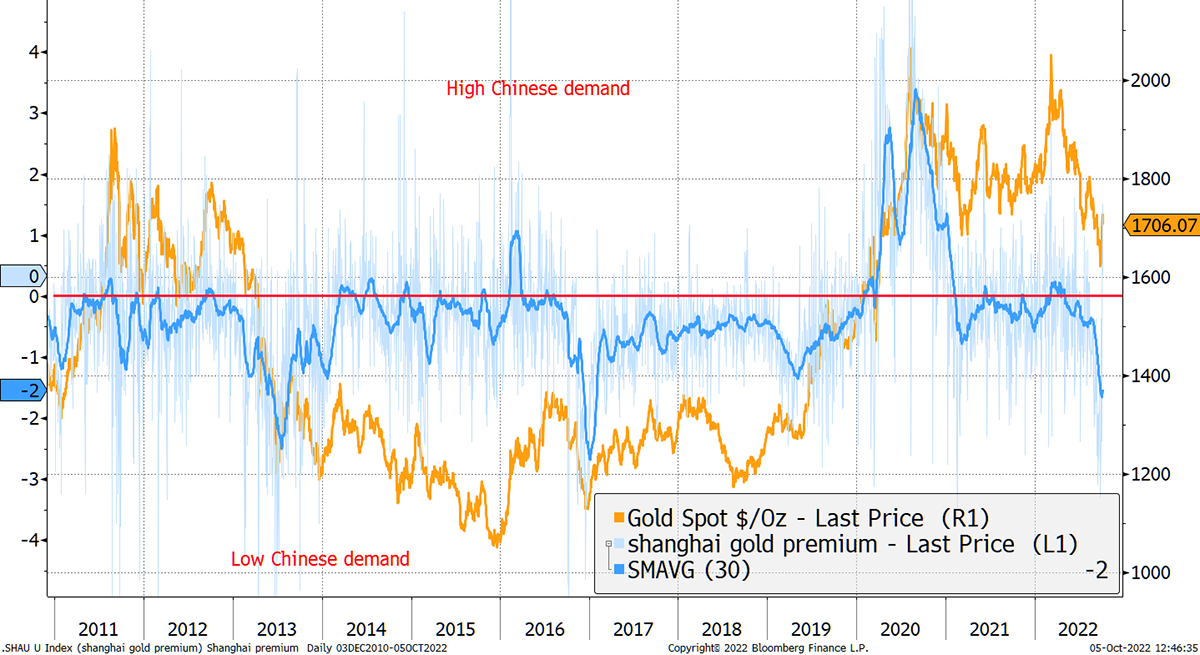
The Shanghai premium has been a good short-term indicator, as shown in 2013, 2016 and 2018 to the upside. Similarly, the Shanghai discount in 2020 was an excellent sell signal. Right now, the message is supportive.
Ten Years of Atlas Pulse
Atlas Pulse first appeared on the Gold Made Simple website in 2012 before moving over to Glint a few years later. I thank Jason Cozens, Declan Cosgrove, and Tom Paterson for providing a platform in those early days.
Then in July 2021, Atlas Pulse moved over to ByteTree. Since we were planning to launch a bitcoin and gold ETF (BOLD) at the time, it made sense to cover gold. It demonstrated to people that knew us through bitcoin that we also knew a thing or two about the yellow metal.
Ten years of writing Atlas Pulse should make this issue number 120, but it is only number 76, which means, at times, I have been lazy. It’s true that in the quiet years between 2014 and 2018 when there was little to get excited about, Atlas Pulse made it to press quarterly or even less frequently. But so long as the dial has pointed towards bull market, Atlas Pulse has appeared each month.
As a multi-asset fund manager by trade, I wanted to know the times you need to own gold and those you don’t. I once carried out a study which concluded that investors should own gold around 40% of the time, avoid it 40% of the time, and sit on the fence the rest. The regime model does this effectively, with all the other things I mention, a bonus.
Time is money. An efficient portfolio owns assets that are likely to perform while avoiding those that don’t. By applying this principle, your money works harder, leading to higher returns. It’s ok to be a gold fan, yet periodically sell it to someone else for safe-keeping until you return. That is a key benefit of a deeply liquid market.
I never have, nor likely ever will, add value in short-term gold trading, but have consistently been on the right side of the long-term trend, with mixed results over the medium-term. Through luck or judgement, the track record over ten years has been excellent.
Summary
The dollar is high enough, the gold regime is fully bullish, and Chinese demand is strong. Yet the valuation poses a risk assuming the Fed follow through with the tightening programme to the bitter end. They likely won’t because the financial system will spectacularly blow up if they do. Besides, if gold returns to fair value, it may prove temporary.
Furthermore, the evidence builds that the bond market isn’t a great forecaster and inflation expectations are simply wrong. The real conundrum is why investors are selling gold when it is obvious that, at times like these, a little gold in a portfolio is unlikely to be a bad thing.
Here’s to the next decade of Atlas Pulse.
Thank you for reading Atlas Pulse. The Gold Dial Remains on Bull Market.
Charlie Morris is the Founder and Editor of the Atlas Pulse Gold Report, established in 2012. His pioneering gold valuation model, developed in 2012, was published by the London Mastels Bullion Association (LBMA) and the World Gold Council (WGC). It is widely regarded as a major contribution to understanding the behaviour of the gold price.
Please email charlie.morris@bytetree.com with your thoughts.
