Prepare for the Dollar Rally

Disclaimer: Your capital is at risk. This is not investment advice.
Atlas Pulse Gold Report; Issue 82
Compared to everything else, gold is in good shape, but it is competing with the world’s most liquid currency, that now pays a 5.25% yield while inflation is falling. The $2,000 breakout was exciting, but the price has now stalled.

Highlights
| Inflation | Victory Against Inflation |
| Valuation | The Gold Price Has a Different Opinion |
| Regime | Bullish, except for the Dollar rally |
| Asset Allocation | China Risk |
Victory Against Inflation
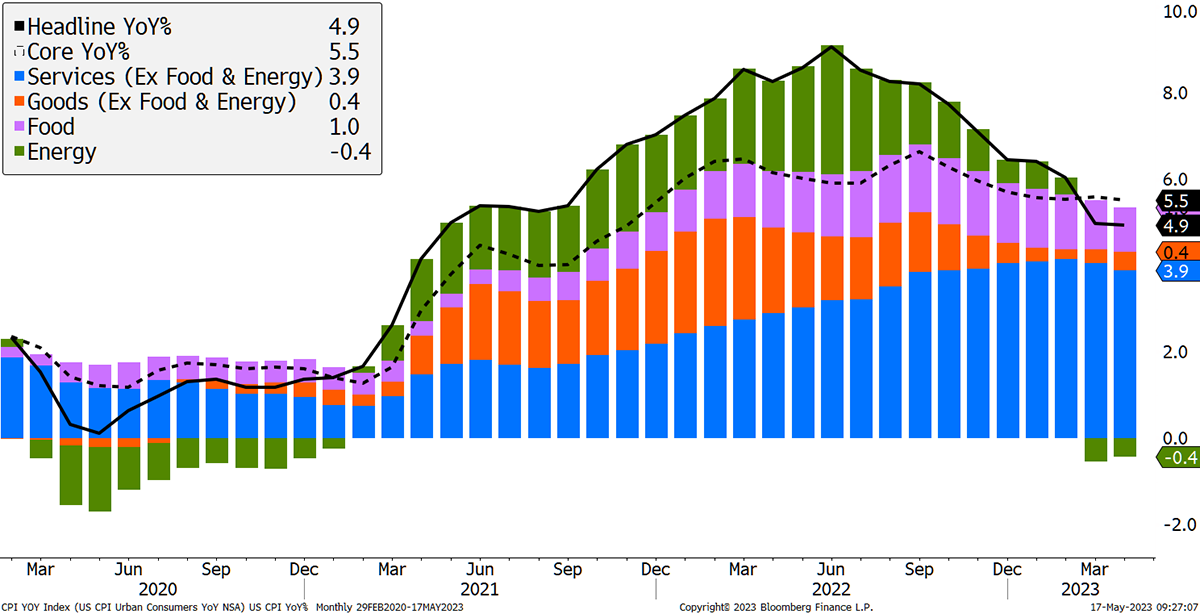
US consumer price inflation (CPI) was a little softer last month. The latest reading of 4.9% feels much more comfortable than the 9% we suffered last summer. Normality is returning, and that is a reason why stockmarkets have been buoyant. But make no mistake, that is unlikely to last forever.
Headline Drops Below Core
Source: Bloomberg
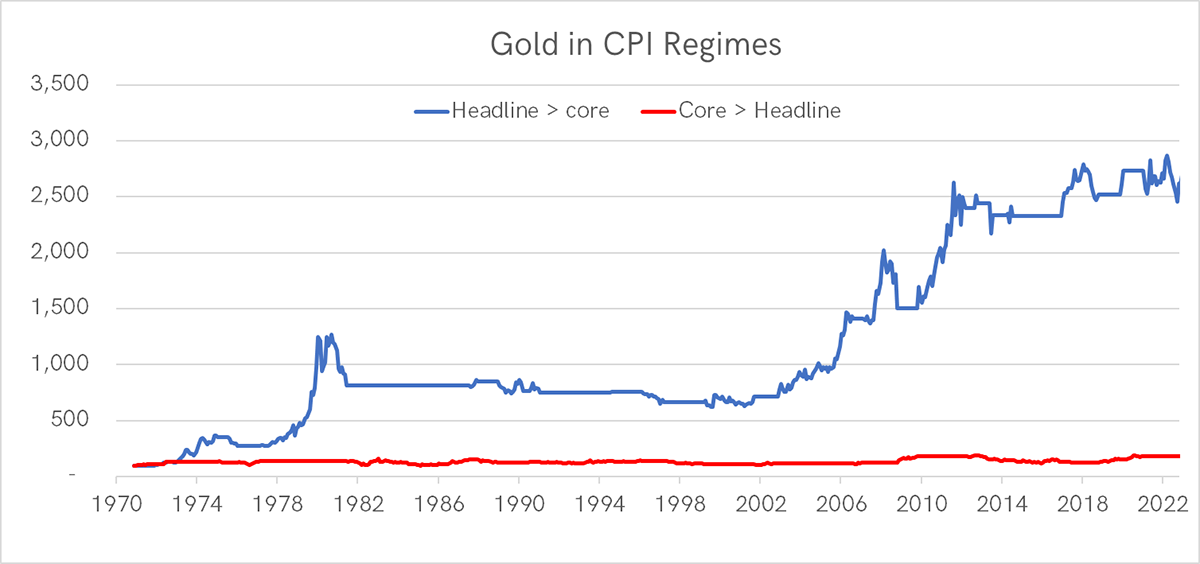
I’m not sure if you remember, but last year I wrote about a dead simple gold model I dreamt up. There was just one question:
If Headline CPI > Core CPI, then own gold. Otherwise, don’t.
I updated the backtest, and it is remarkable how when headline CPI > core CPI, gold has returned 6.5% per annum since 1972, in contrast to 1.3% when it hasn’t.
Source: Bloomberg, ByteTree
The model reminds us that gold is a commodity, albeit a very fine one. Commodities have come under pressure again while the dollar is poised to rally. I’ll get to these important issues.
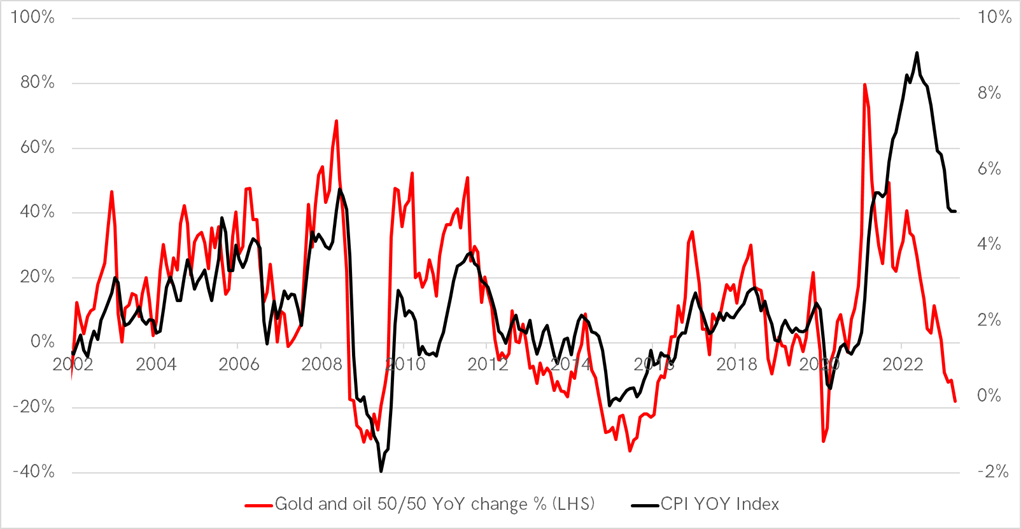
We have another simple inflation model which looks at gold and oil in an equally weighted basket. With gold down 3% and oil down 41% since the start of the war in Ukraine, this has been pulling inflation down. This model currently forecasts a fall in CPI to zero.
Gold and Oil Prices Lead Inflation
Source: Bloomberg
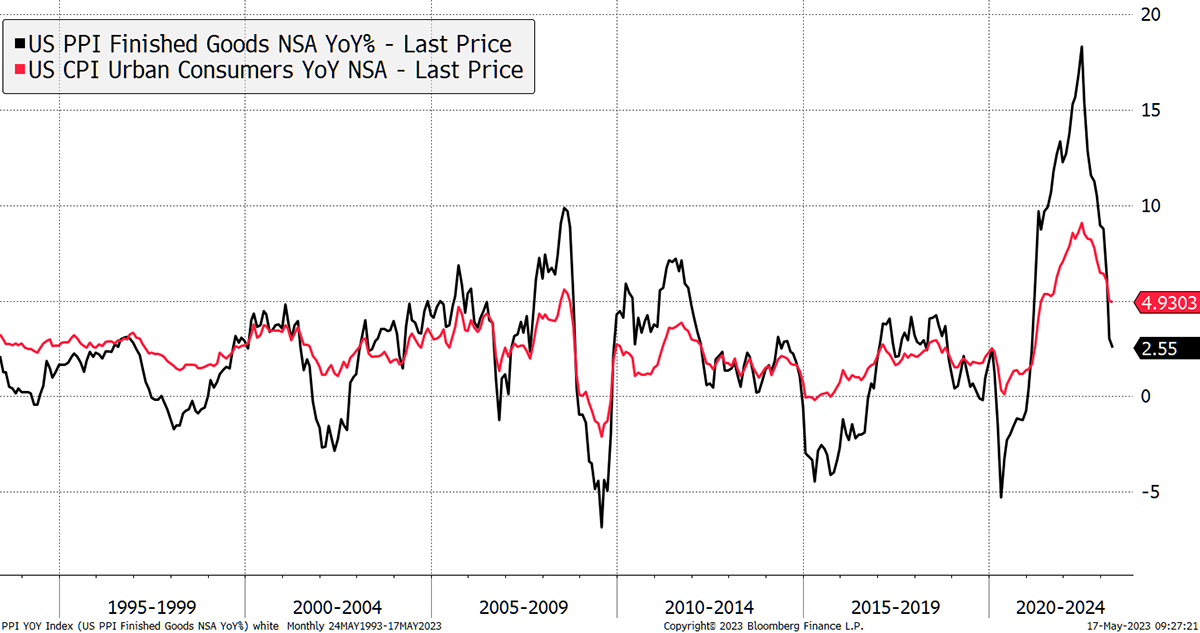
There is also the relationship between producer (PPI) and consumer prices to consider, with the former generally more volatile and often leading. PPI looks at the cost of manufacturing goods and is, therefore, sensitive to energy, industrial materials, and other input costs. This too suggests that inflation has been crushed.
Producers versus Consumers
Source: Bloomberg
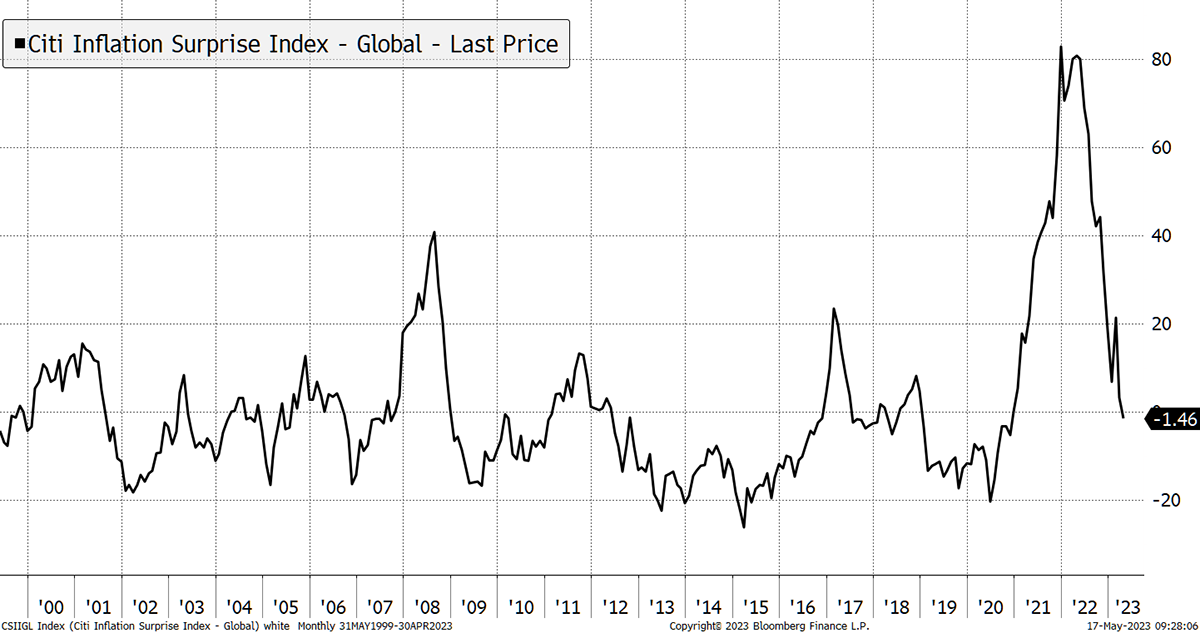
My last chart on inflation indicators looks around the world. The Citigroup Global Inflation Surprise Index is also saying the battle has been won. What a difference from last year.
Global Inflation Contained
Source: Bloomberg
When you consider that inflation in Turkey has fallen from 85% to 44%, this all starts to fit together. Peak inflation is behind us, but we still don’t know where it will land or what the long-term average will be.
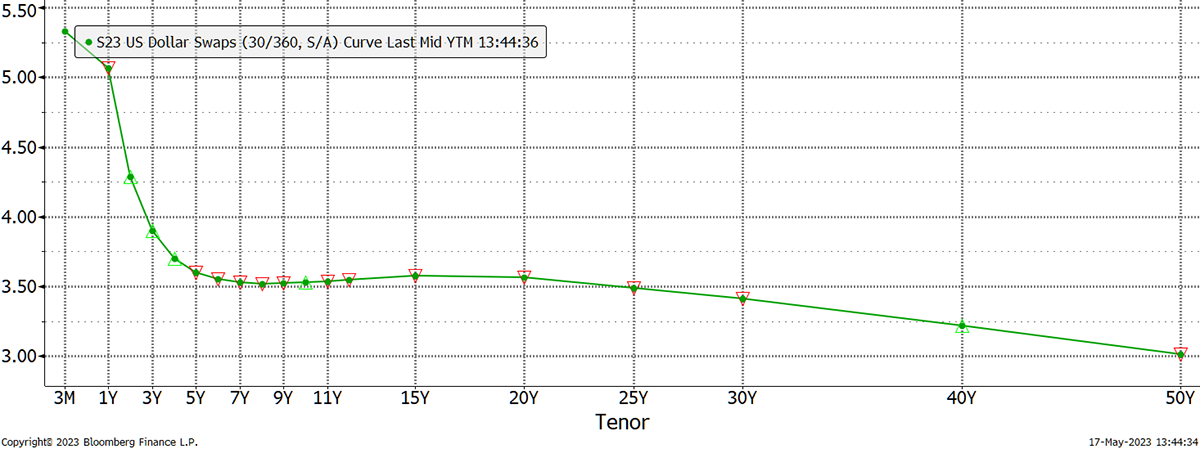
This is crucial because it dictates future monetary policy. US interest rates are 5.25%, yet as you can see, the 50-year bond pays just 3%. With less than 4% for 3-year bonds, the bond market is pricing in for interest rates to be slashed in the near future.
Interest Rate May Seem High but Bond Yields Remain Too Low
Source: Bloomberg
As Andy Lees of the Macro Strategy Partnership writes:
“Main Street and Wall Street have taken on a huge amount of risk, betting against the Fed, and in doing so, limited the effect of the rate hikes. In a circularity, economic and market data and price levels are being supported by this increased risk, justifying the risk that is being taken, and justifying the Fed’s continued tightening. Unfortunately, with neither side backing down, and indeed adding to the risk, this game of chicken will end in a collision.”
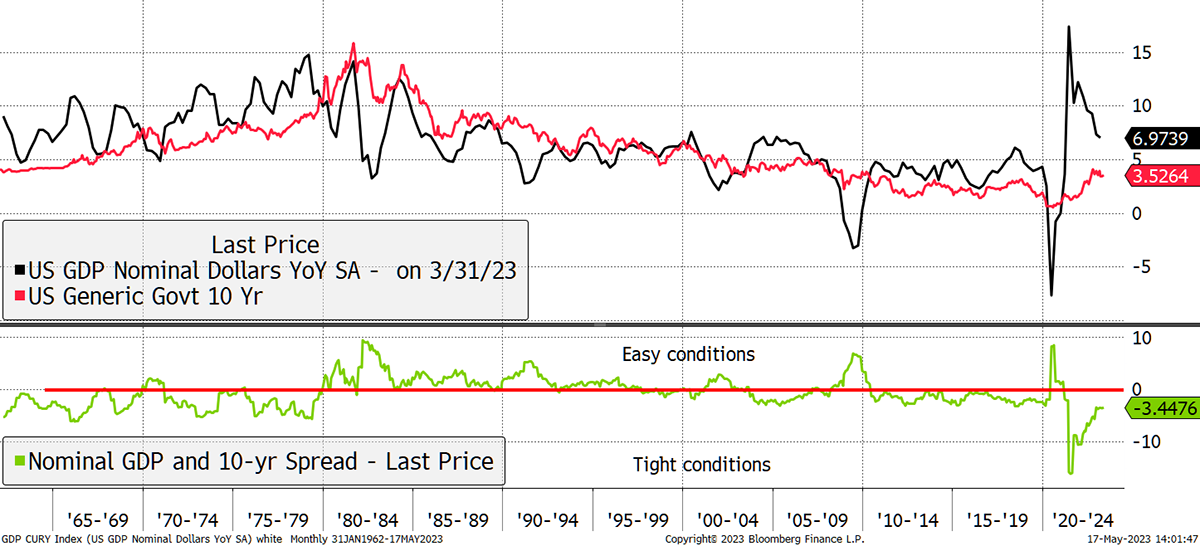
Which brings us to the relationship between nominal GDP growth (real growth plus inflation) and the 10-year yield. Remarkably, and despite the pain we have been through, monetary conditions remain too easy because the bond yield remains too low. That can be seen in the green spread, sometimes referred to as the Wicksell Spread, which is a similar idea.
The Wicksell Spread
Source: Bloomberg
This spread was too easy in the 1960s and 70s, which led to higher inflation. It was much tighter in the 80s and 90s, leading to low inflation, and progressively easier since. Many see easy money post-2000 to be the root cause of today’s inflation and why it might be stickier than implied by commodity or producer prices.
The Gold Price Has a Different Opinion
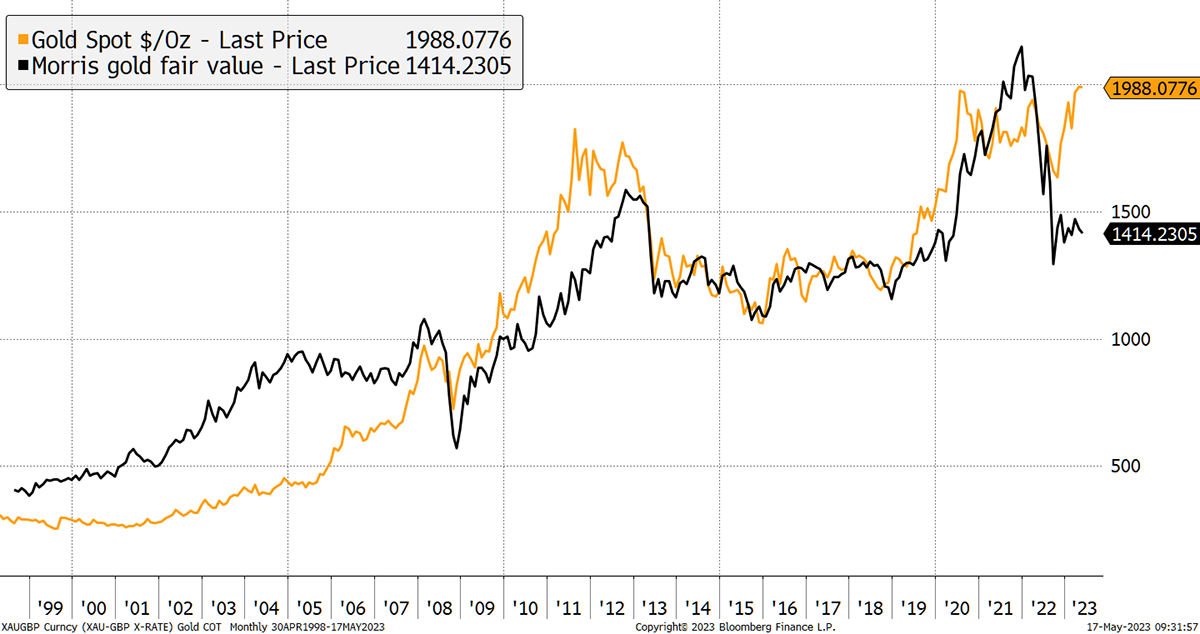
For the past year, I have been trying to reconcile the 40% premium in the gold price. It is easy to shout “bubble”, but I struggle with that as investment flows have been minimal. Bubbles depend on the madness of crowds, and while the crowds are certainly mad, they have been largely absent from the gold market.
The demand for jewellery, bar and coin has also been soft, leaving the central banks to take the lead. They’ve done a splendid job, with record purchases of gold, and for good reason. My fair value method compares gold to 20-year TIPS, and the gap is the 40% premium.
The Gold Premium Is 40%
Source: Bloomberg
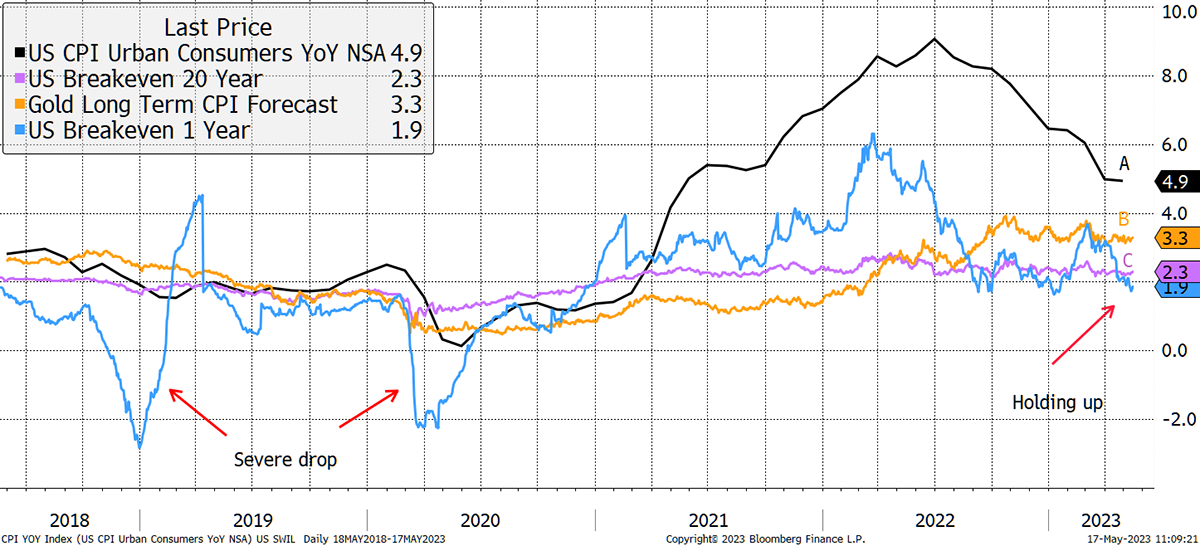
This next chart ought to help, but it is a bit complex. CPI was 4.9% over the past year (black) and, according to TIPS, will be 2.3% over the long term (purple). This low number is which gold trades at a premium to TIPS. I also show the short-term inflation implied by TIPS in blue. This is volatile but is saying CPI will be below the 2% target within a year.
CPI Past and Forecasts
Source: Bloomberg
The alternative explanation is that TIPS are wrong in pricing future CPI. Instead, gold could be right, and there is no premium at all. If that is the case, TIPS are massively underpriced, and the current gold price implies long-term CPI will be closer to 3.3%, as shown by the purple line. This is the implied future CPI according to the gold price, thus turning the premium on its head.
A. CPI was 4.9% last year
B. The gold price implies long-term CPI will be 3.3%
C. TIPS prices imply long-term CPI will be 2.3%
B or C or somewhere in between? For markets, it matters a great deal.
If this thesis is true, then the long-term real rate (bond yield less future CPI) is 1% lower than the market believes. That is one hell of a difference when it comes to fighting future inflation. It also means interest rates could stay much higher for much longer.
Still, TIPS are undervalued under this scenario, which is an important takeaway.
Regime
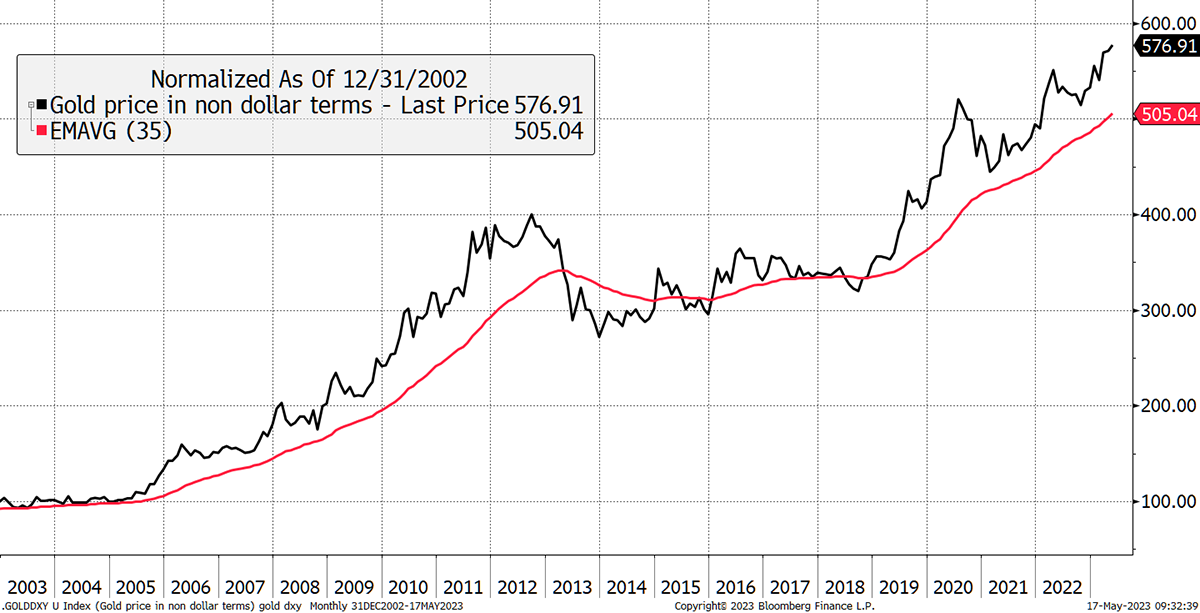
I like to check in on the key gold regime charts. When we look at the gold price trend in multi-currency, it remains bullish, with a very healthy upward-sloping 35-month moving average.
Gold at Work Around the World
Source: Bloomberg
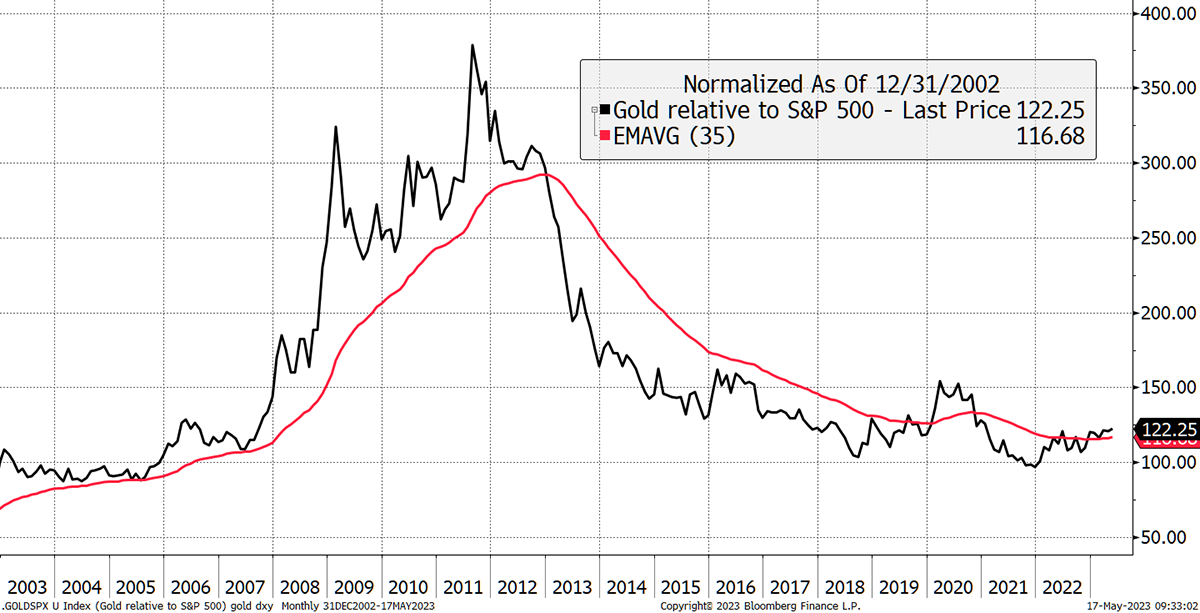
And against equities, it appears to be in an uptrend as well. This is extremely important because when investors realise gold is a winner, they sell stocks and buy gold, which can become a self-reinforcing feedback loop.
Gold Leads the S&P 500
Source: Bloomberg
With 2 out of 3 signals bullish, the final consideration is the real interest rate. I tend to use the current CPI (4.9%) and the interest rate (5.25%). That is now 0.35%, so comfortably below the 1.8% pain threshold that tends to kill off gold bull markets. Still, the gap is narrowing.
Mega Assets
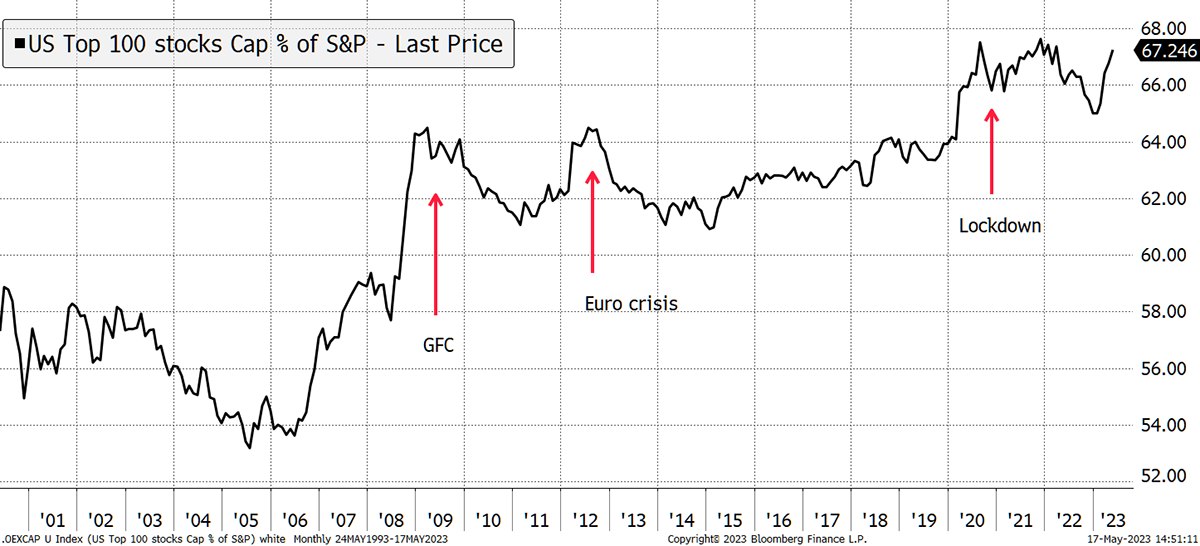
Gold is a mega asset, like short-dated treasuries or blue-chip stocks. In recent months, these have been the safe place to be. The last major market panic saw the top 100 stocks rise from 54% of the S&P 500’s total value to 64% by the time of the financial crisis in 2008. This time we have surpassed that level and are close to an all-time high above the level associated with lockdowns and the freezing of the world economy. The top 100 stocks make up two-thirds of the top 500.
Big Is Beautiful
Source: Bloomberg
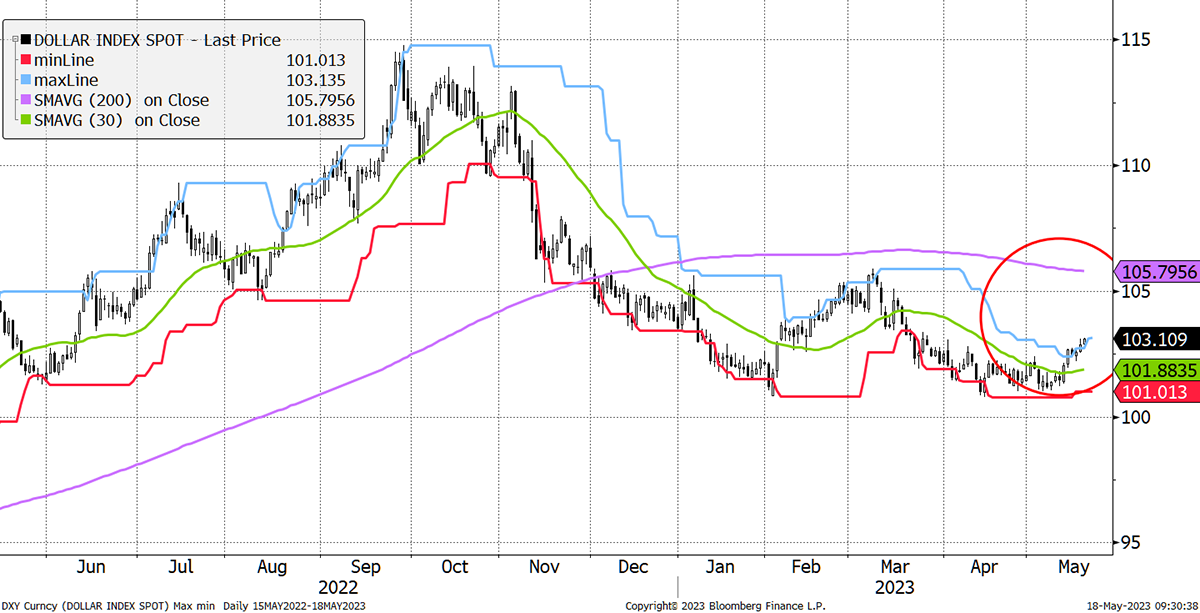
Although we are not seeing the crisis indicator flashing red, nor the stockmarket go into a tailspin, we are seeing a bid reappear for the dollar. This is generally a spoiler alert for markets and urges caution.
Dollar on the Move
Source: Bloomberg
The dollar has broken above the 20-day max line (blue), while the 30-day moving average (green) is positively sloping with price (above). We don’t yet know if this will be a major rally, but it has clearly begun. Gold is one of the good guys, and while the price in US dollars is likely to ease off, at this point, there is no cause for alarm.
Asset Allocation
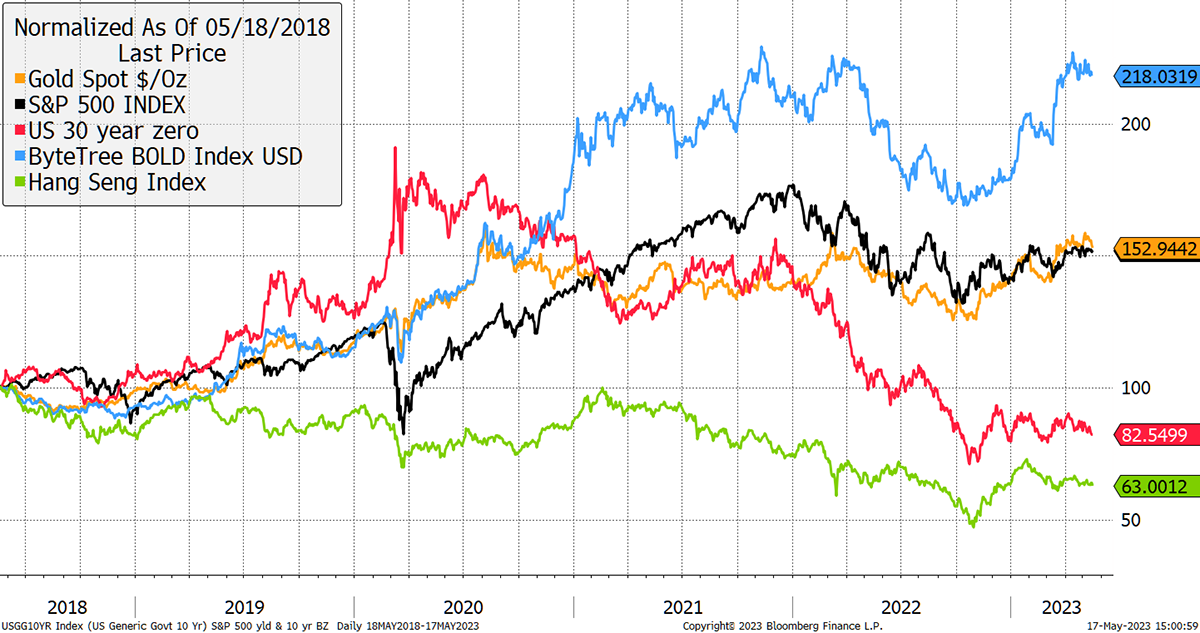
As I mentioned earlier, the bond market has held up well because it is ignoring interest rates. If the long bond had seen yields rise to 5% or more, prices would have collapsed to new lows, and the stockmarket would follow. The fear of recession has prevented that.
Major Assets – five years
Source: Bloomberg
Ironic, isn’t it? Investors are worried about the economy, and so stockmarkets hold up.
Remember the good old days pre-2021 when stocks and bonds were negatively correlated? Today they remain positively correlated, and if bonds fall (yields rise), stocks will follow.
Gold has done a good job in recent years, but obviously not as good as BOLD. Sprinkle a little bitcoin into the mix, and the real magic begins! (BOLD1 Index on Bloomberg)
There’s one other thing in the chart, and that is the sorry state of Hong Kong, or as we should call it these days, China. It’s a weak market, and property loan defaults are back in the news. The message from the stockmarket is that the reopening from lockdown is a disappointment.
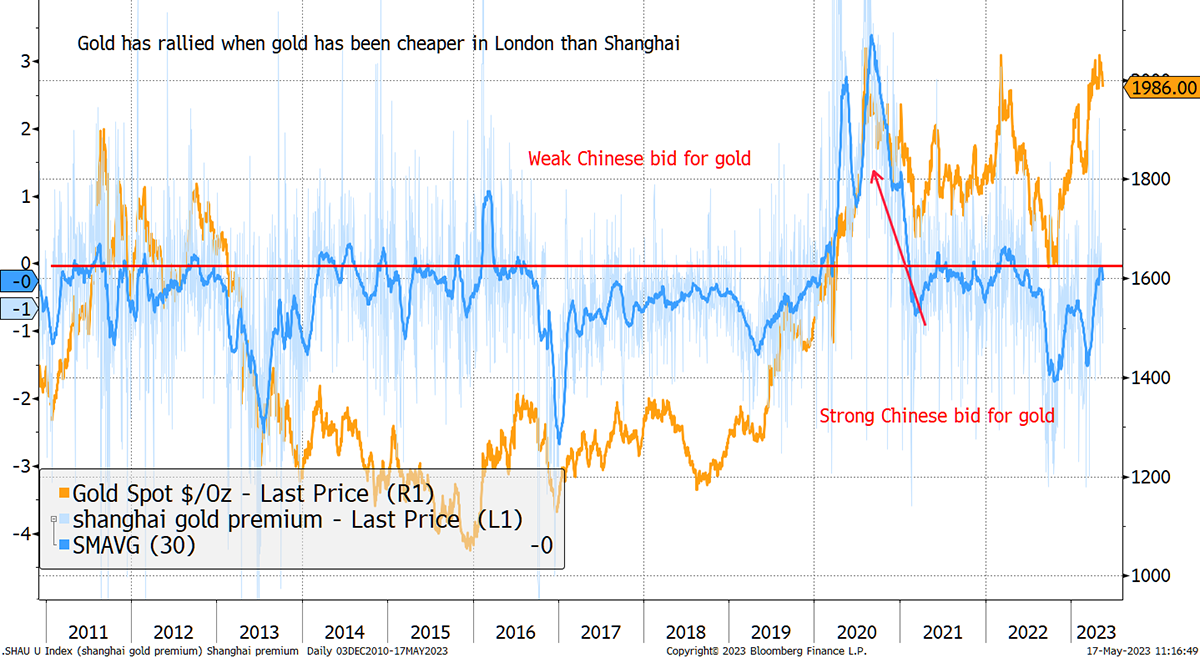
Therefore, I can’t finish without mentioning the Shanghai Gold Premium, which has all but disappeared. The surge in the gold price since October was in part triggered by a premium China. That is, gold is more expensive in China than in the West, and so there is high Chinese demand. That premium has narrowed, which could cause demand from the Peoples’ Bank of China to slow?
Shanghai Premium Closes
Source: Bloomberg
I would be much more worried if the Shanghai premium swung to a discount as it did in 2020. That put downward pressure on the gold price. This time things are more neutral, but gold investors need to manage their short-term expectations.
ByteTree Premium
Asset prices are adjusting to an entirely new paradigm. The Multi-Asset Investor and the Adaptive Asset Allocation newsletters are brought to you by investors who have been there and seen it all. The model portfolios that you receive as a PREMIUM investor will help guide you through these troubled waters. £25 a month to help protect your savings? Money well spent.
Summary
Compared to everything else, gold is in good shape. But it is competing with the world’s most liquid currency that now pays a 5.25% yield while inflation is falling. The $2,000 breakout was exciting, but the price has now stalled. Still bullish, but patient.
I have been writing Atlas Pulse since October 2012. If you wish to receive the next issue of Atlas Pulse ahead of the rest, then subscribe here.

Comments ()