Monthly Rebalancing Report;
The new weights on 31 July for the BOLD Index are 24.5% Bitcoin and 75.5% Gold.
The ByteTree BOLD Index (BOLD) rose by 1.7% in June, taking the return for the year to 17.4% in USD terms. Over the month, Bitcoin fell by 3.9%, Gold rose by 2.4%, global equities rose by 3.3%, and US Treasuries went down by 1.2%.
At the month end, the Bitcoin weight had fallen to 22.8% while Gold had risen to 77.2% of the BOLD Index. As a result, the BOLD portfolio rebalancing saw 1.7% added to Bitcoin and Gold reduced accordingly.
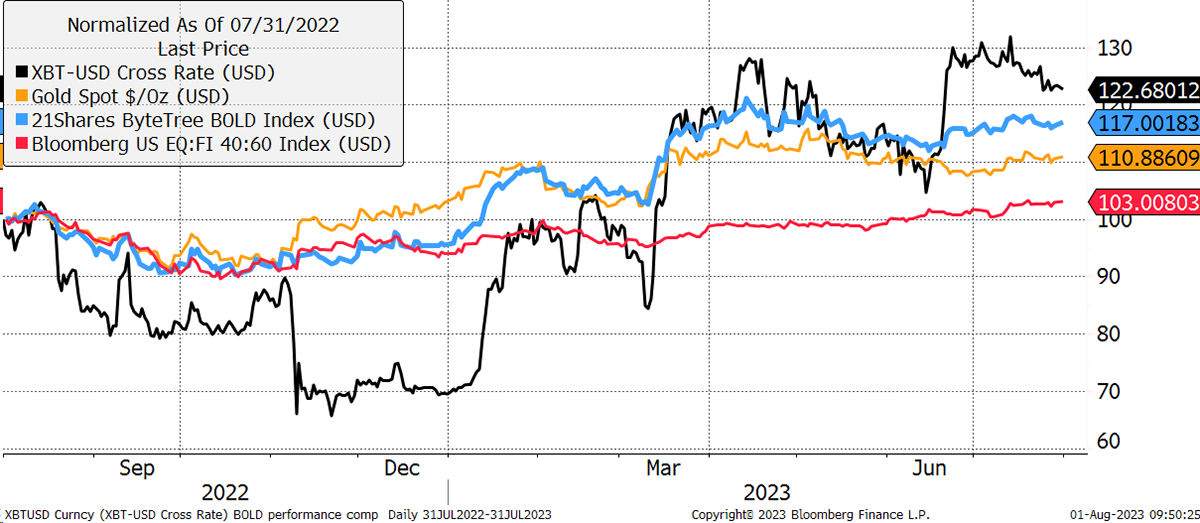
Over the past year, BOLD has been overtaken by Bitcoin but leads the Gold price. All assets are ahead of a 60:40 Balanced Portfolio over the period.
BOLD, Bitcoin, Gold and a 60:40 Portfolio over One Year
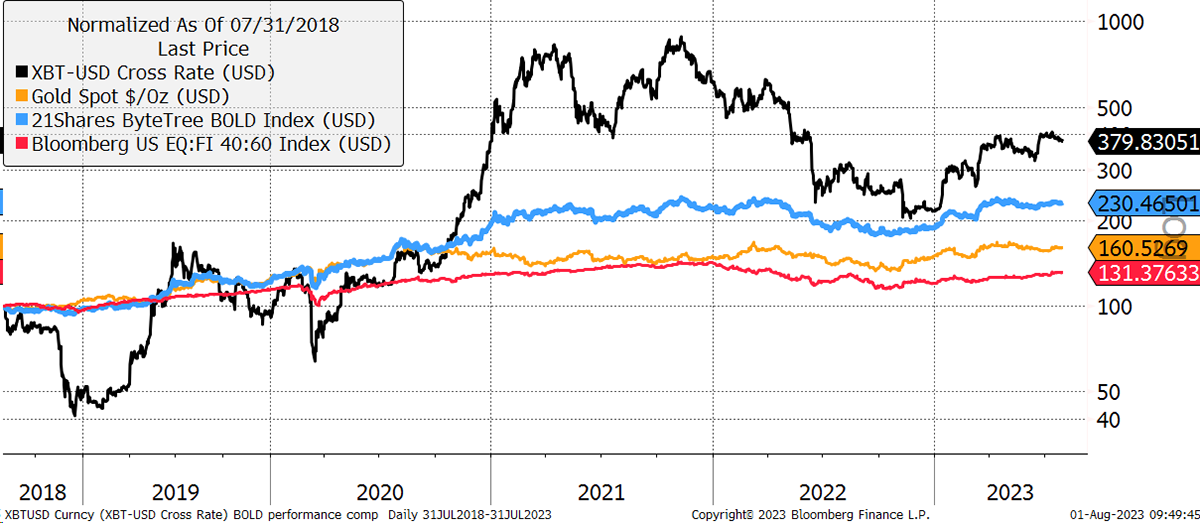
Over five years, BOLD is +130% against 280% for Bitcoin and 60% for Gold. A 60:40 Balanced Portfolio has risen by 31%.
BOLD, Bitcoin, Gold and a 60:40 Portfolio over Five Years
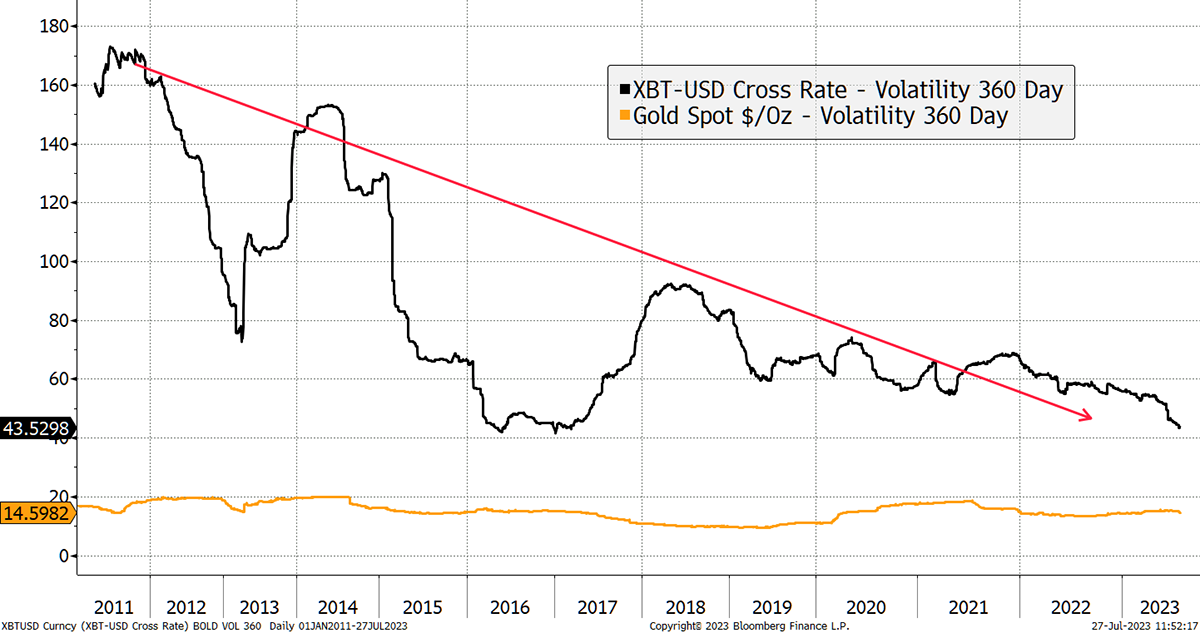
At the end of July, the 360-day volatility for Bitcoin and Gold were 41.8% and 13.5% respectively. Once again, Bitcoin volatility fell and is challenging the lows seen in 2015. The blockchain was quiet back then, with transactional activity of approximately $200 million per week. Today it is over $30 billion, which means this is the lowest level of price volatility while Bitcoin has been associated with a vibrant monetary network.
Bitcoin and Gold Past 360-day Volatility
As Bitcoin volatility falls, its credibility as a serious asset rises. To put it into perspective, Bitcoin’s 41.8% volatility is slightly higher than Google’s but less than Amazon, Tesla or Nvidia over the past 360 days. It is remarkable that mainstream investors continue to ridicule Bitcoin yet gladly embrace high exposure to the leading technology companies which dominate the index funds. In that sense, Bitcoin’s perceived risk significantly exceeds its actual risk, making it a powerful opportunity for contrarian investors.
As Bitcoin’s volatility falls, its exposure increases in the BOLD index in line with the following formula.
Risk-weighted asset allocation techniques improve risk-adjusted returns. BOLD uses the “inverse volatility” methodology, which means the more volatile asset has a lower weight in the basket and vice versa.
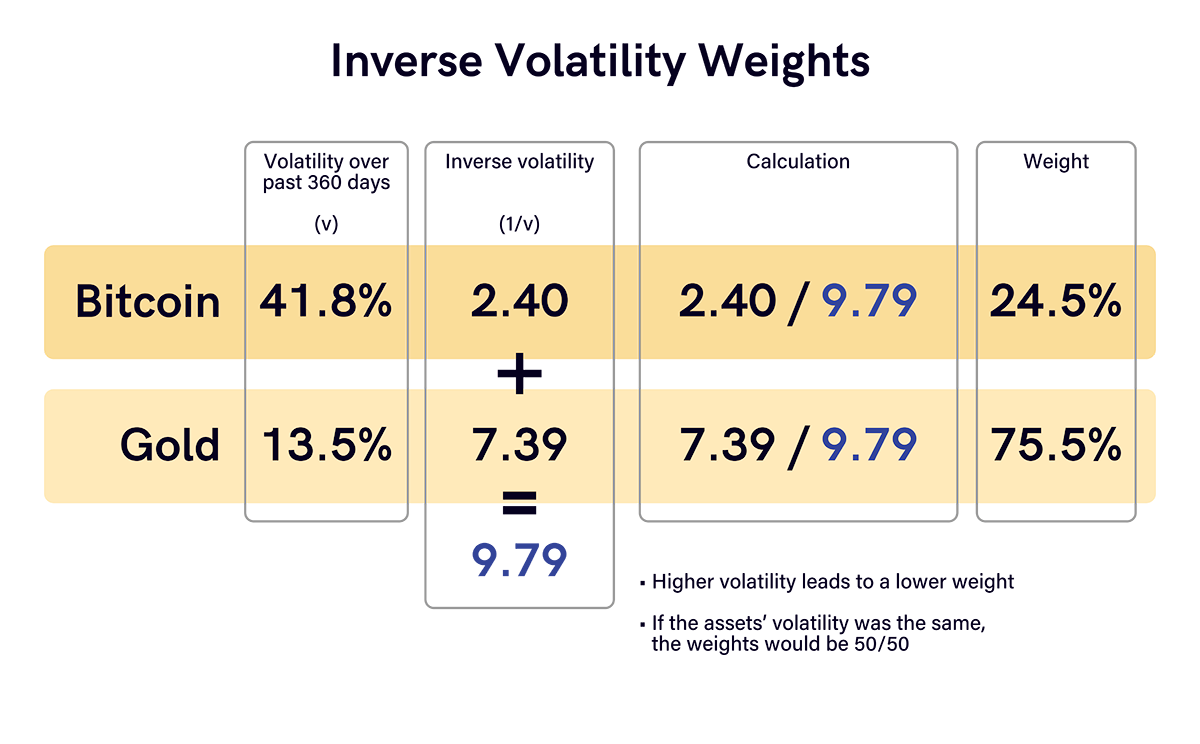
As a result of the rebalancing, Bitcoin exposure in the BOLD Index is the highest ever, and Gold’s is the lowest.
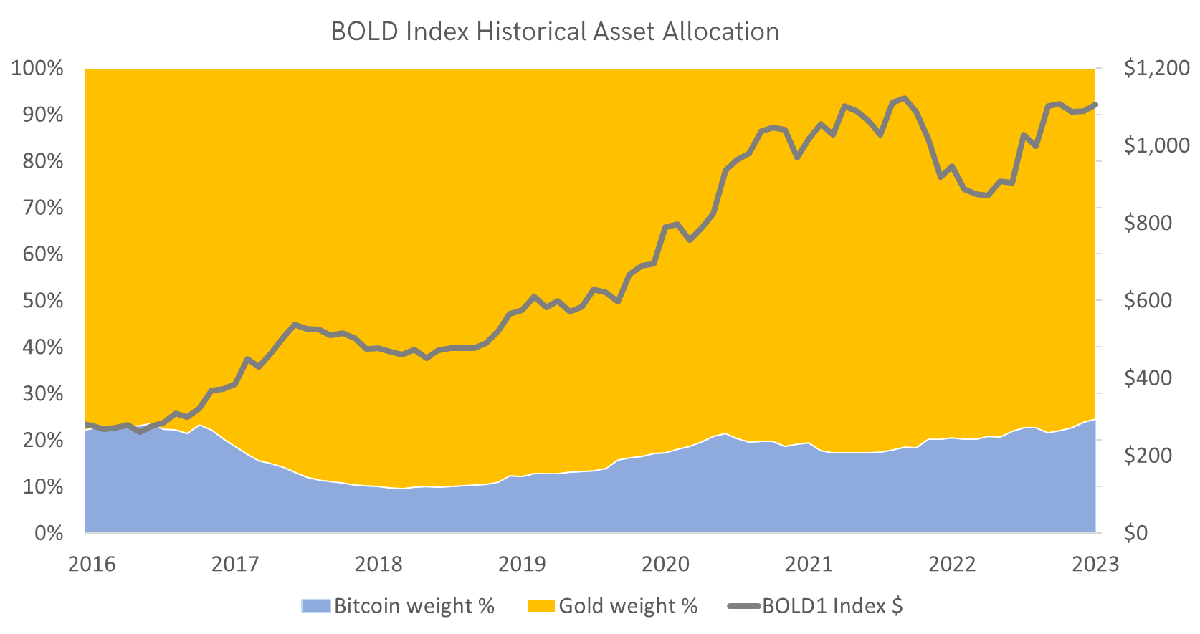
BOLD not only benefits from capital appreciation from rising Bitcoin and Gold prices but also from monthly rebalancing transactions and risk management from asset allocation. Monthly rebalancing transactions, buy low and sell high, capturing a little excess return in the process. In July, once again, one asset rose while the other fell. Bitcoin and Gold naturally have low correlation, and it is rare that both assets perform well or badly at the same time. This helps to keep the BOLD Index volatility low and only marginally higher than Gold.
Gold is currently trading at a premium to ByteTree’s fair value, while Bitcoin is trading close to fair value as the network remains vibrant. Gold is doing well as it finds itself in a unique role within an uncertain world. The premium has fallen slightly as inflation expectations have risen in July, buoyed by a firmer oil price.
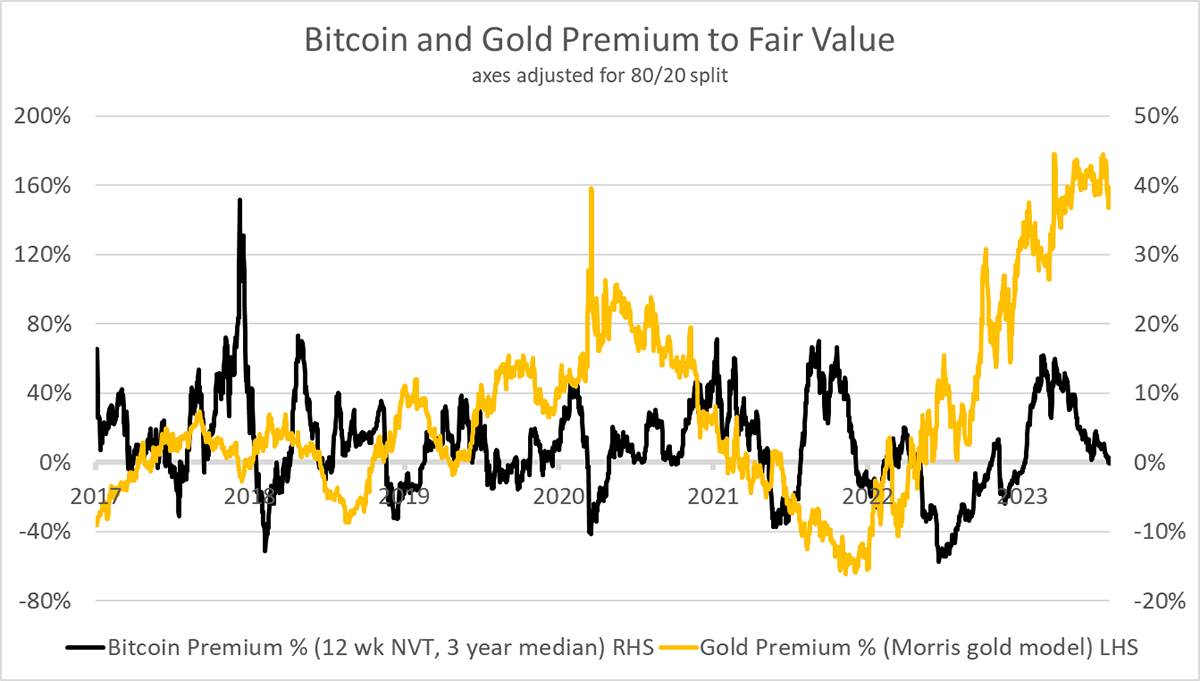
The natural non-correlation and diversification benefits of these assets are highlighted by the naturally offsetting premiums above. Bitcoin and Gold are opposing forces.
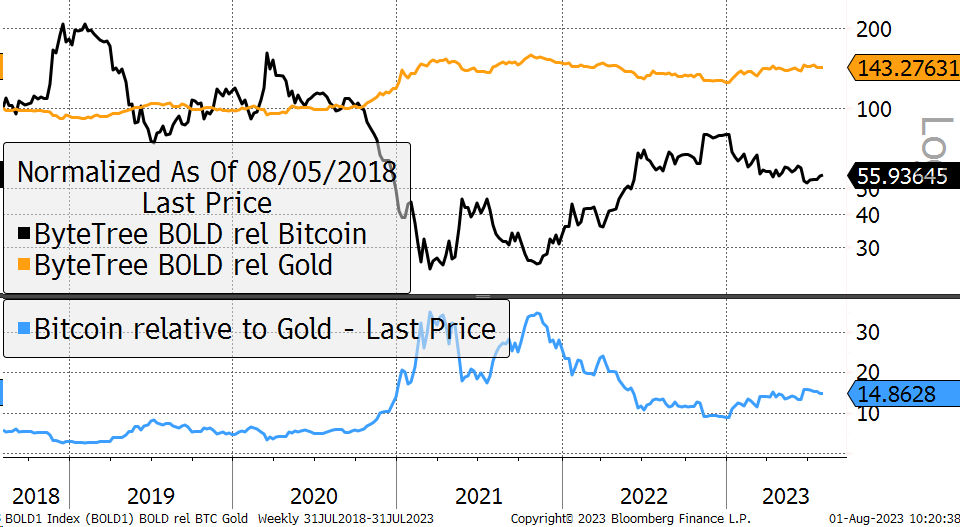
The expectation is for Bitcoin to have the upper hand over the next year as the next halving (April ‘24) is nine months away. Based on the last three cycles, we would normally expect to see a period of strength in the run-up. But it is hard to forecast which will be the stronger asset, just that whichever it is, the other will compliment it over the long term.
A Bitcoin is worth 14.8 ounces of Gold, as shown in blue, up from 10 ounces at the beginning of the year.
Bitcoin Versus Gold
BOLD gives investors exposure to the two most liquid alternative assets on a risk-weight basis. This is a highly efficient asset strategy that has mirrored the growth in the global money supply more closely than any other asset combination. Since 2015, the G20 money supply has grown at 6.2% per annum in contrast to BOLD1, which has grown at 24% p.a., or 3.9x faster.
BOLD has been an Effective Hedge Against Global Monetary Supply Growth
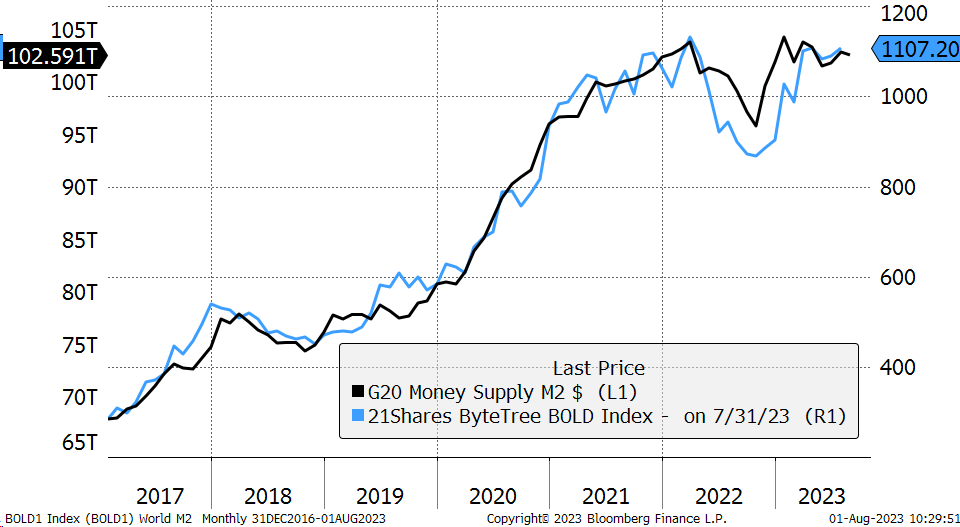
The money supply is currently shrinking, but slowly. Historically, this would urge caution for financial markets. If the dollar remains soft, which it has this year so far, there seems to be enough buoyancy for markets to remain calm. Yet should the US dollar start rising again, this will put downward pressure on asset prices. A key driver for the BOLD Index is inflation. Commodities have been firm in July, led by oil. It will not go away quickly or easily, and BOLD is a natural inflation hedge.


