Bitcoin Miners’ Revenue Back Above $10 Billion per Year
Disclaimer: Your capital is at risk. This is not investment advice.
ATOMIC 92;
Since bitcoin came to be in 2009, the miners have been rewarded with $56,045,093,177 worth of bitcoin. That currently equates to 8% of bitcoin’s market cap. This is a vital part of the bitcoin economy, and the miners’ hard work secures the network, making it digital gold. Without this process, bitcoin would be little more than a digital tulip.
ByteTree ATOMIC
Analysis of Technical, On-chain, Macro, Investment Flows and Crypto Stocks.
Highlights
| Technicals | Strong Enough |
| Investment Flows | All-time High |
| On-chain | Good Time to be a Miner |
| Crypto | The Alts Have a Fairer Fight |
| Macro | Stay Bullish, but Stay Realistic |
Technical
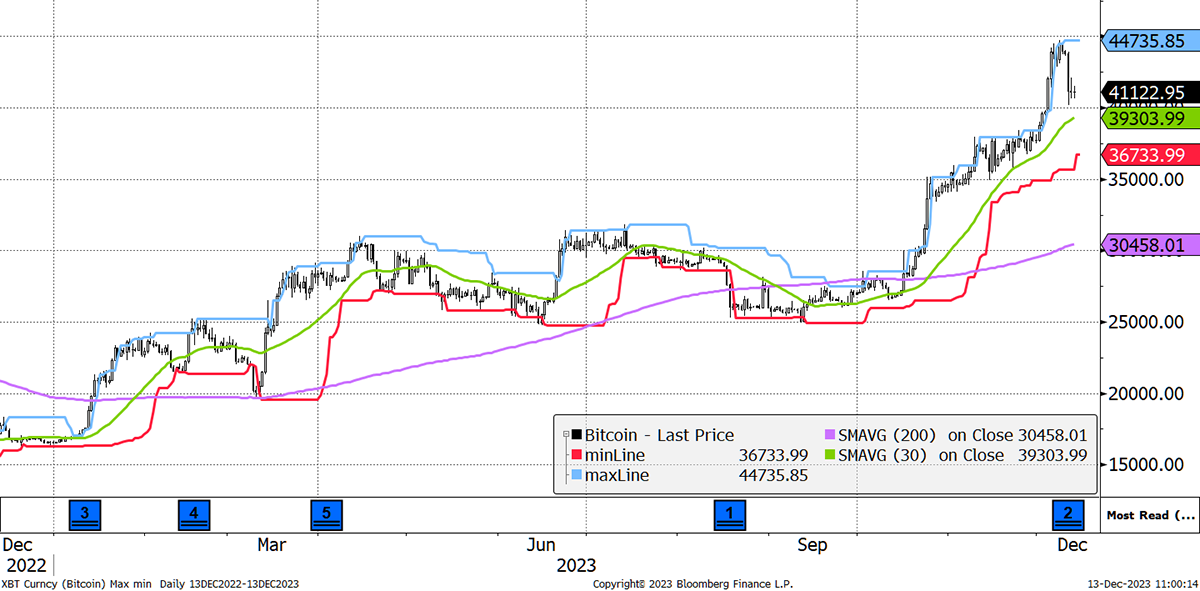
Having peaked at $44,735, bitcoin crashed to $41,122 this week. Considering the price was $35,826 in the last ATOMIC in November, we should get over it soon. A staggering 159% this year, and halving is coming in April. Bitcoin’s trend is up.
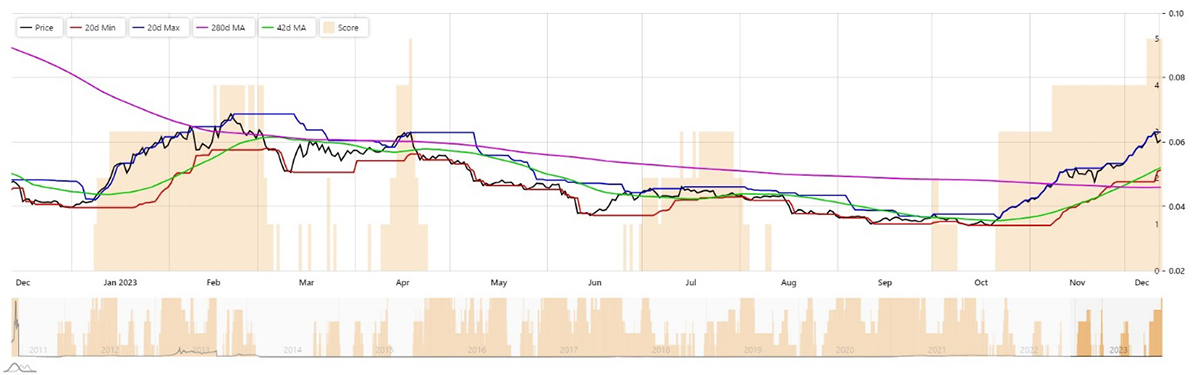
BitUSD – Bitcoin in Dollars – ByteTrend Score 5/5
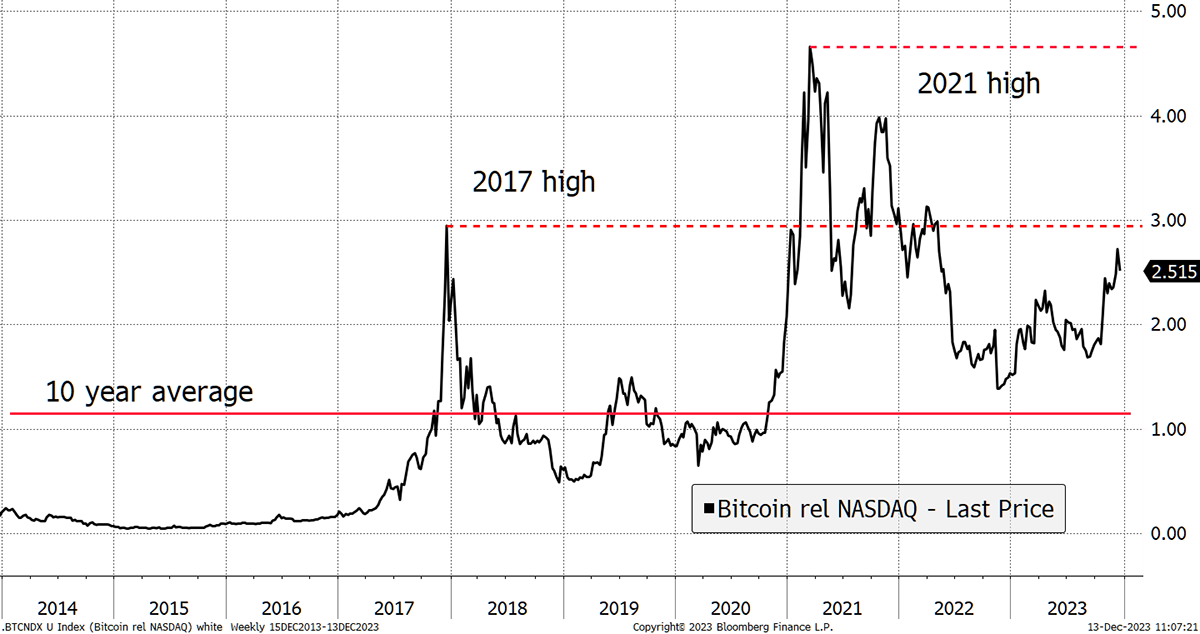
The Bitcoin in Nasdaq (BitDAQ) chart never tires, and it may be surprising to see how bitcoin is still below BitDAQ from the 2017 high. Considering bitcoin is only 2x since that time, i.e. $20k to $40k, it makes sense. What struck me is how the 10-year average is around one, and BitDAQ never fell below that level, even at the depths of the recent bear market. The next target is the 2017 high and then the 2021 high, which is nearly 2x from here. If you take the simple view that the world’s liquidity jumps between these assets, and it’s bitcoin’s turn again. The next halving cycle may see this reach 8 or perhaps more (on the scale shown).
BitDAQ - Bitcoin in NASDAQ – ByteTrend Score 5/5
Speaking of halving, April is not far away. I wanted to remind you how in previous cycles, bitcoin has moved around an average price. In epoch 2, that was $388; in epoch 3, it was $5,720; and in the current epoch, $30,588.
Bitcoin Average Prices by Epoch
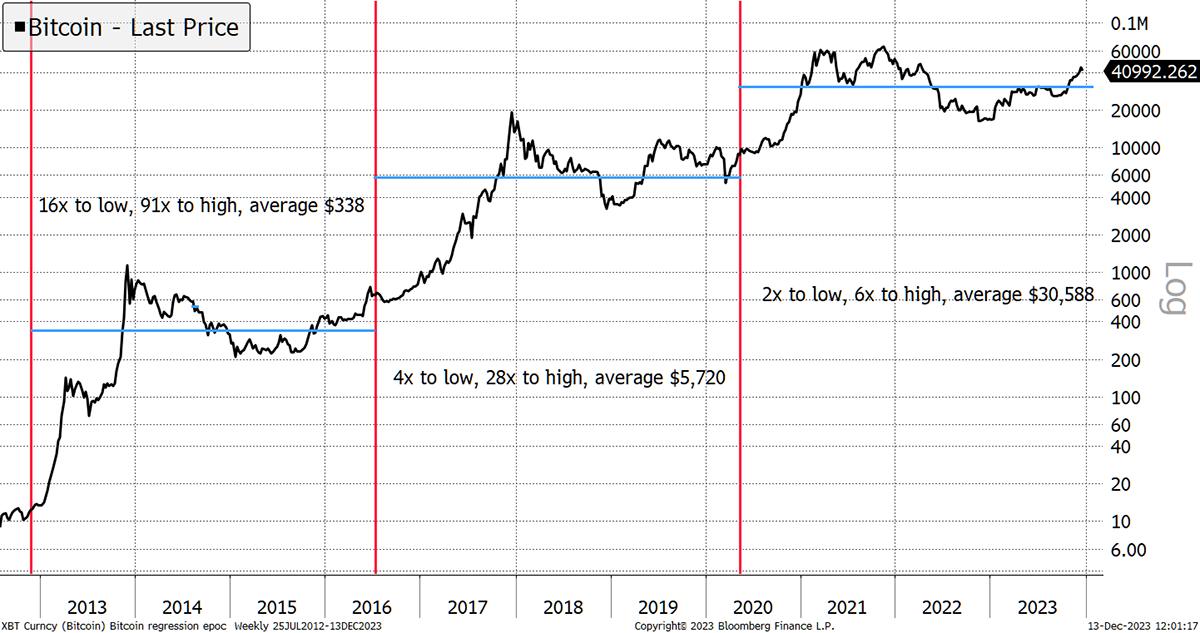
The price has always started below average, rallied above, crashed back below, only to finish back above. Even the pandemic didn’t manage to break that simple idea. It implies that the current price feels about right to enter the next epoch (halving). At this point, a new all-time high would be too much and too early. Better to see that late next year or even in 2025. Holding $40k would work well for bitcoin, but history tells us it never remains quiet for long.
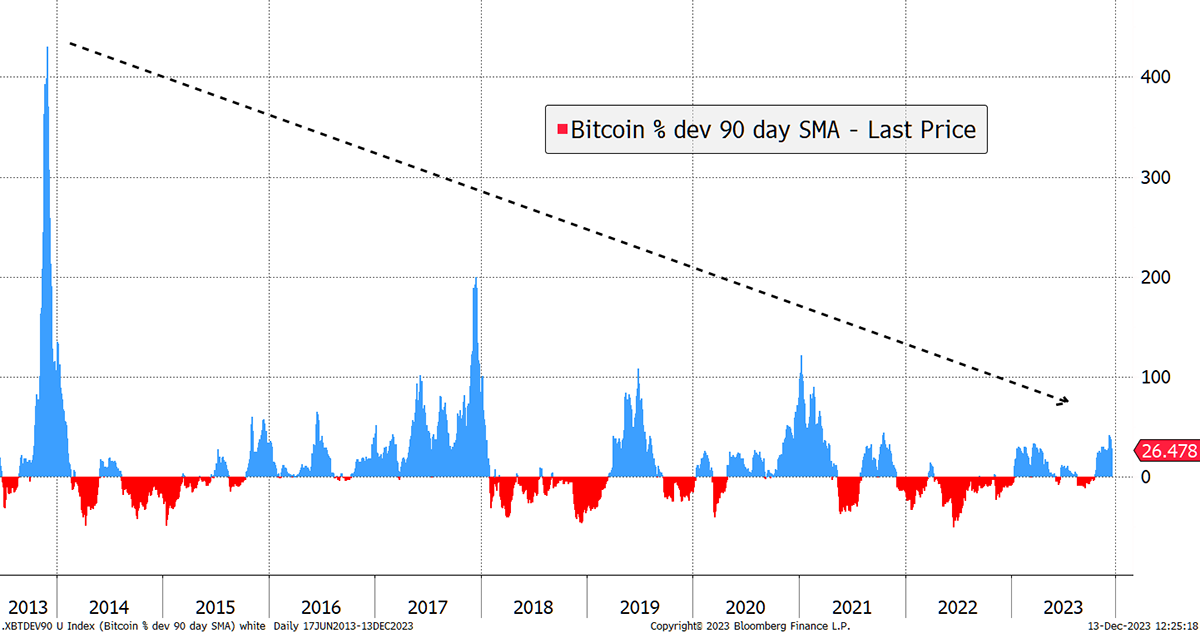
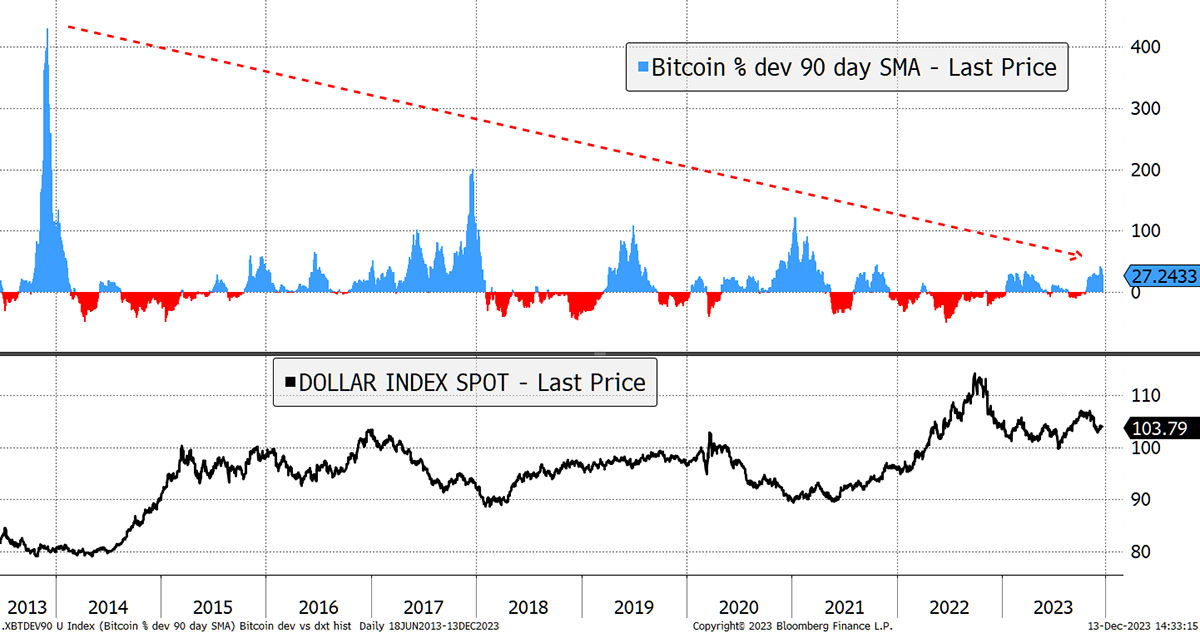
Bitcoin is currently 26% above its 90-day moving average, down from 40% last week. In 2013, overbought meant 400% (above the 90-day moving average!). In 2017, 200%, and in 2021, 100%. Just as we acknowledge bitcoin’s long-term volatility decline in our BOLD index, it follows that price deviations are in decline. Can we conclude 400%, 200%, 100% implies the new overbought is 50%? Possibly, and I hope so because that’s how credible assets would behave.
Is Bitcoin Overbought?
Besides, it’s harder to shake a trillion dollars around than a few billion.
Investment Flows
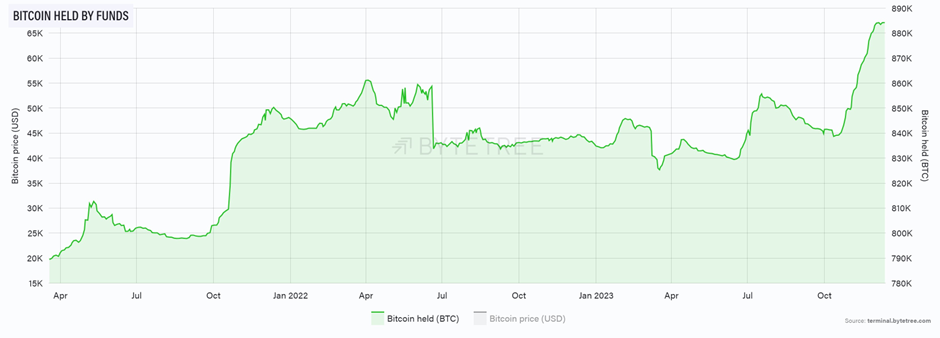
As bitcoin grows up, it will have greater appeal with institutional investors. They are coming but at a slow pace. ByteTree ETF flow data shows that funds have increased exposure by 6% and now own 885,000 BTC. That progress.
More alarming perhaps is the Grayscale Bitcoin Trust (GBTC), which has seen no new money invested in bitcoin, but a surge in demand for its shares. The discount has closed from 49% to 9%. That means GBTC is up 303% this year, twice as much as bitcoin. I am pleased we made that call a year ago.
GBTC Discount Has Narrowed
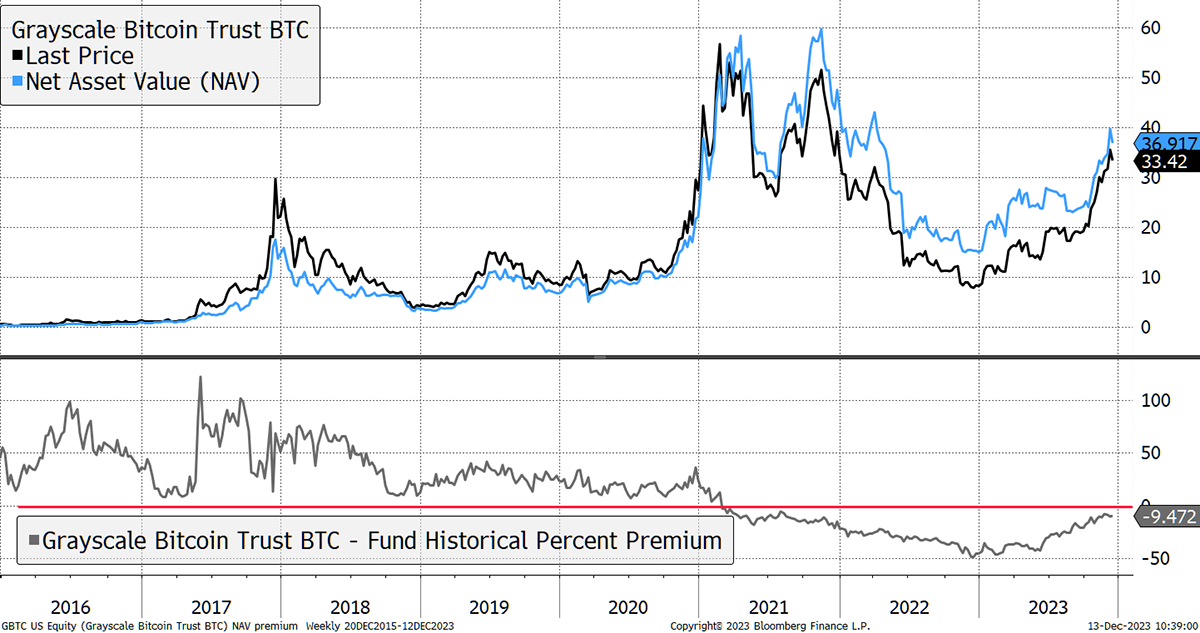
Naturally, this is all about the anticipation of the new Bitcoin ETFs in the USA and GBTC’s ability to become one. If it does, there’s a little upside from here, but it is highly unlikely to trade at a premium again, especially if and when ETFs are approved. GBTC holders might be better off switching to an ETF and locking in the spot price.
Moving onto MicroStrategy (MSTR), Michael Saylor’s Bitcoin holding company, it has announced further purchases and now holds 158,400 BTC. MSTR shares trade at a 53% premium to fair value. Saylor issues new shares for cash and buys bitcoin with the proceeds. The share count has increased by 49% since he turned into a bitcoin maniac in 2020.
MSTR is a volatile stock, around 3 times that of bitcoin. The shares currently trade 53% above the value of the net assets. To determine that, I add the value of the bitcoin held, assume $1 billion for the legacy software business, and deduct $2.2 billion of debt. Then compare that to the market cap, and we have a discount or premium. The current level is a 53% premium. It is mid-range, but don’t be fooled into thinking that is normal.
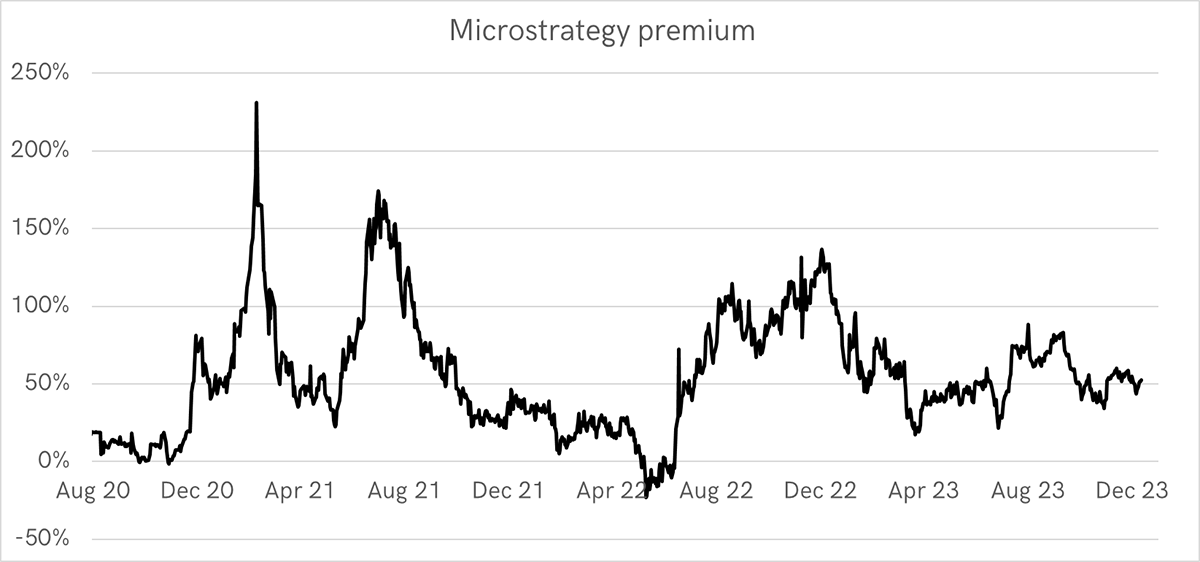
The return to a 0% premium, which is inevitable and could happen quickly if the ETFs are approved, means 33% bitcoin underperformance from here. Worse still, if MSTR ended up like GBTC, at a 49% discount, MSTR would need to lag bitcoin by 66%. To put it another way, bitcoin could treble, and MSTR shareholders could remain flat. At this point, it’s a very bad bet, given ETFs are on the way.
Sadly, many UK investors own MSTR because GBTC and the European ETFs have been blocked by the platforms. In most cases, MSTR hasn’t been blocked because it’s a stock, and that’s hard for them to justify. Saylor has played the regulatory arbitrage very well, but the risks have now increased. If the SEC approve spot ETFs, then MSTR will lose its strong bid, and the premium will evaporate. Be warned.
On-chain
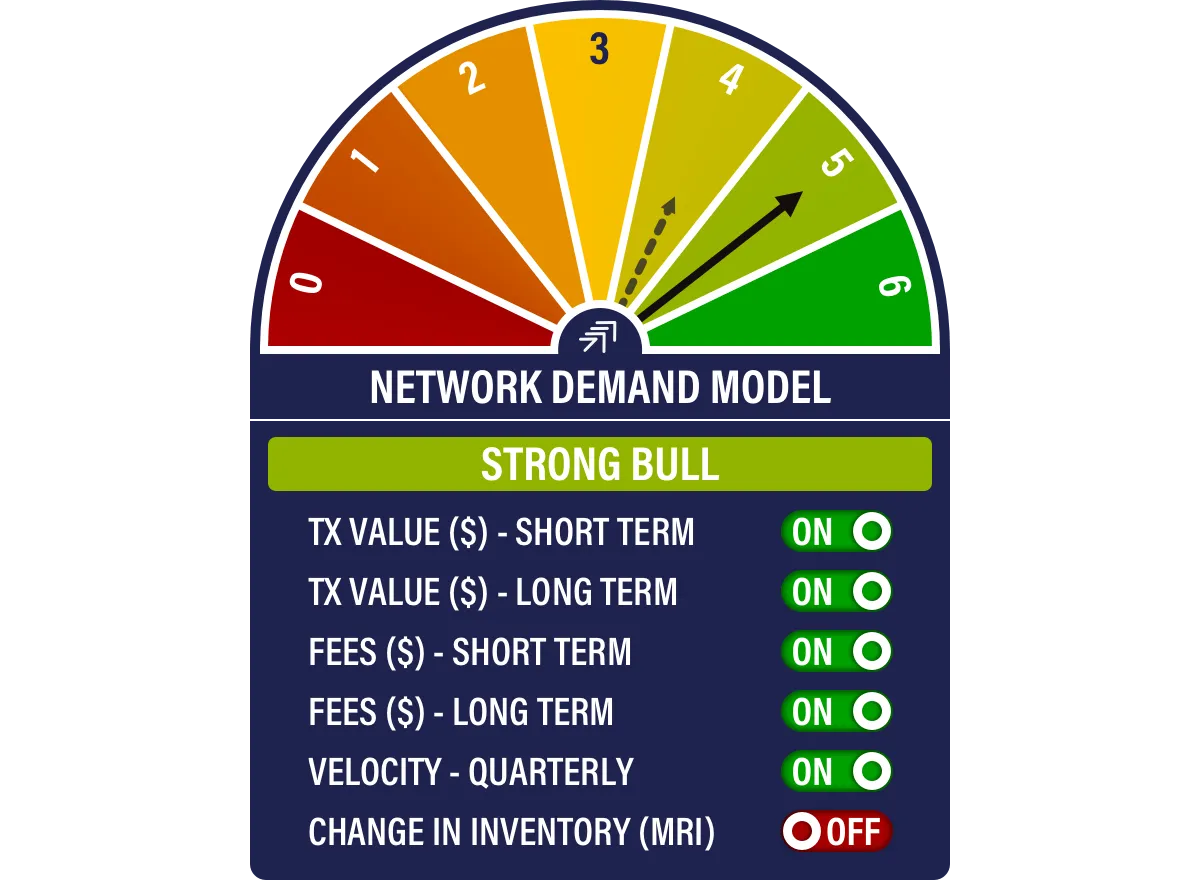
The blockchain is strong, with 5 out of 6 of our indicators cooking on gas. You can see it below, and essentially, when our model scores 4 or better, the bitcoin price normally appreciates. Not bad for a model dreamt up several years ago.
The most important thing to understand is that bitcoin is not a thing. It’s a reference that owns a part of the Bitcoin Network. There is nothing physical about it and hence, not a thing. A network is where people come together with a common interest, and in this case, it is to store and exchange value around the world.
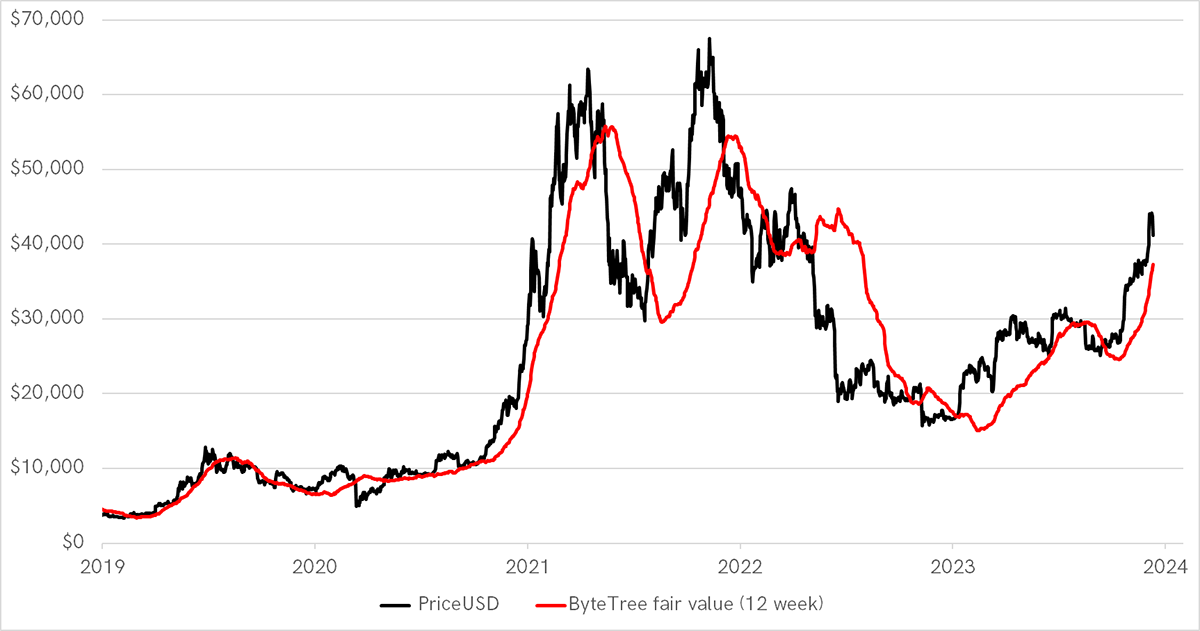
The dollar price of bitcoin has consistently followed the amount of dollar equivalent value transferred across the Bitcoin Network. Fair value is just under $40,000, but is catching up.
Bitcoin Is Close to Fair Value
Some people still do not realise that bitcoin has no offices, CEOs, board members or even a phone number. It is entirely decentralised and global. That is the genius. Great ideas are copied, and bitcoin has thousands of copycats, but they are all worth zilch because they don’t have this.
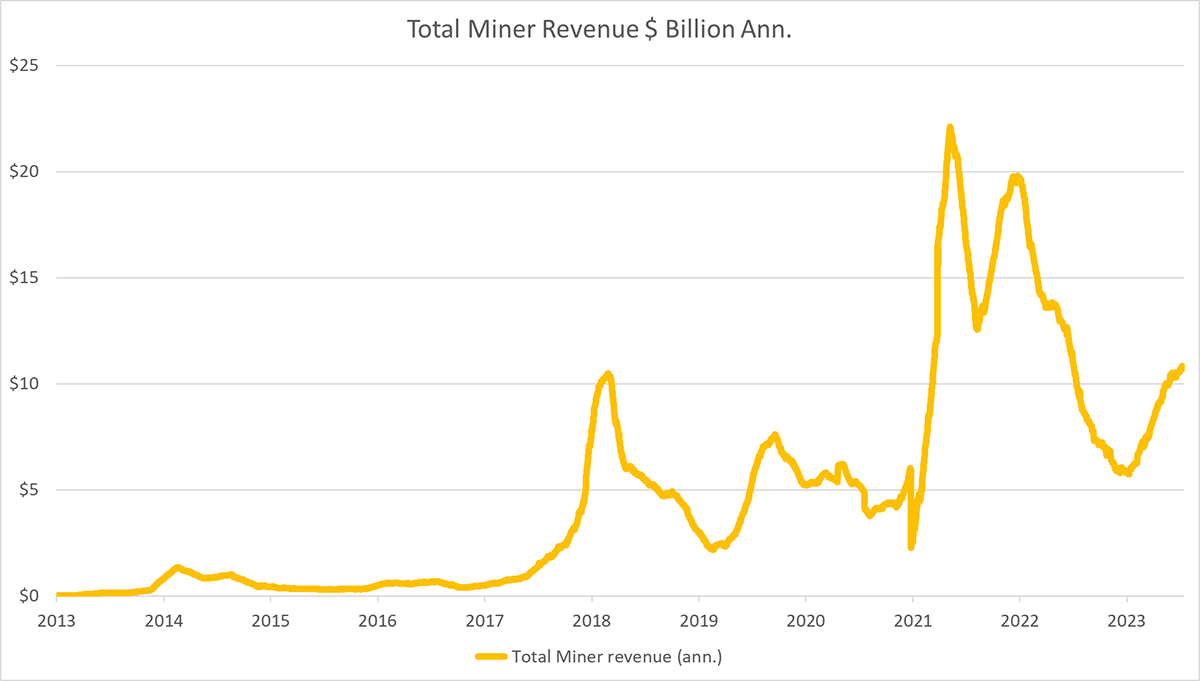
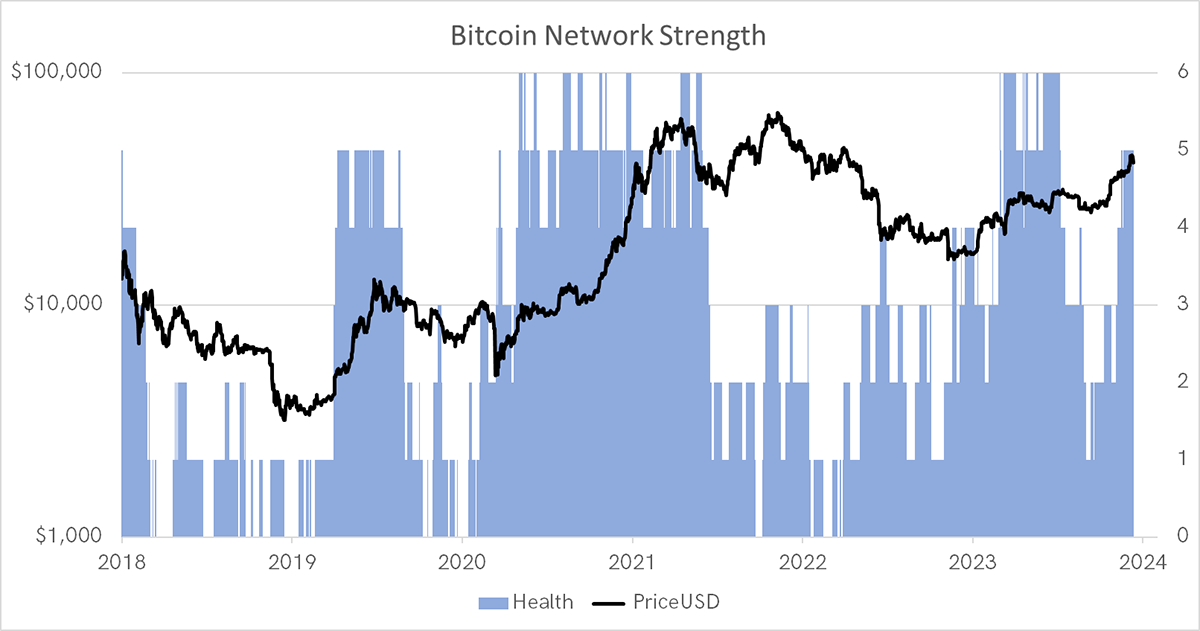
The people in the engine room support the network, and they are all volunteers. Anyone can volunteer and, if they work hard, will be paid handsomely in bitcoin for their efforts. You just need a very powerful computer, a hefty power source, and a bit of know-how. The miners got paid $20 billion per year at the last peak in 2021. That fell to a mere $5 billion and is now back above $10 billion.
To copy bitcoin, you need to:
- Copy the code – easy as it is publicly available
- Build a global network and brand – difficult and takes time
- $10 billion per year
Since bitcoin came to be in 2009, the miners have been rewarded with $56,045,093,177 worth of bitcoin. That currently equates to 8% of bitcoin’s market cap. It’s remarkable, and no copycat comes close. This is a vital part of the bitcoin economy, and the miners’ hard work secures the network, making it digital gold. Without this process, bitcoin would be little more than a digital tulip.
Crypto
Speaking of digital tulips, we turn to the altcoins, of which there are thousands as mentioned. At ByteTree we acknowledge that most are hopeless, but a select few will have lasting value. Our job is to find them. It does seem that alt season, where the best altcoins can surge, is progressing well.
The MVDA Crypto Index dates back to 2015, and does a good job of reflecting the market’s progress. Back then, bitcoin made up 80% of the market, and today, a still highly impressive 52%. Naturally, it was 100% in 2009 when crypto began. Then came Litecoin (LTC), then the onslaught.
I plot the MVDA against bitcoin, and the returns appear to be similar, which is no great surprise since the index is 59% bitcoin and was once 80%. The difference is therefore a mix of the change in dominance (bitcoin weight in the index) and the performance of alts.
Bitcoin and Altcoins
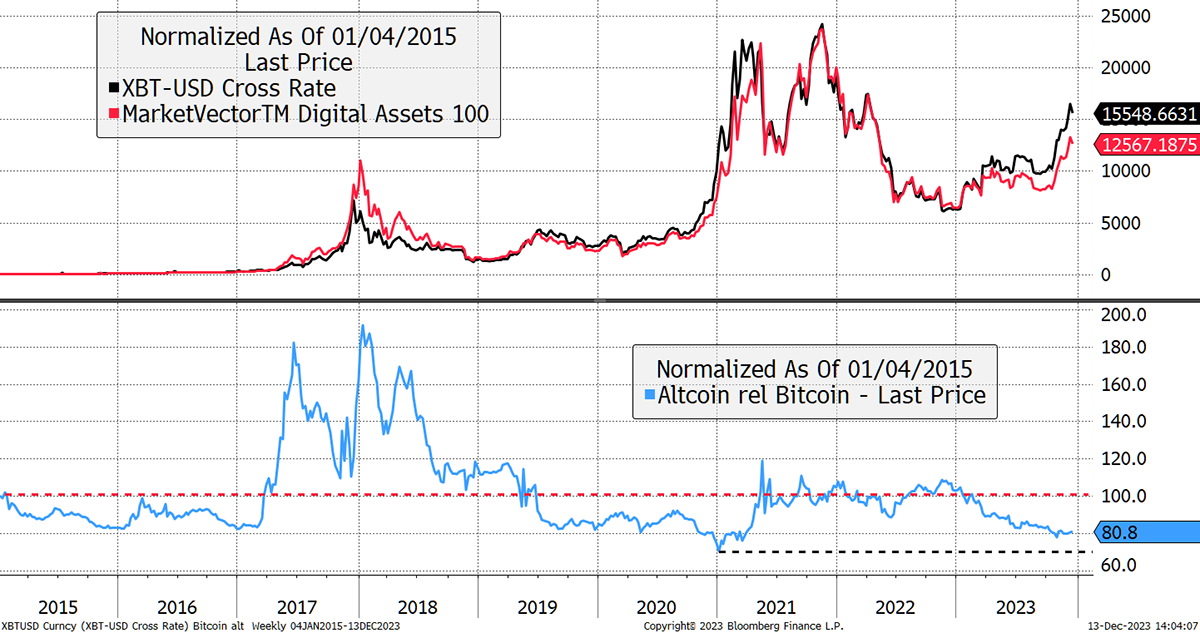
The lower blue line shows the relative performance, or in crypto speak, MVDA in Bitcoin. There have been two great alt rallies, in 2017 and 2021, where altcoins gained much more than bitcoin (2x or more). Given alts are modest in the index, it implies they beat bitcoin by much more than 2x. The entire raison d'être for ByteFolio was to identify the leading altcoins that could beat bitcoin over time. It isn’t easy, but when the alt season arrives, you simply want to own a basket of decent tokens and strap in.
I am intrigued by how the blue line (alts in BTC) has mean reverted around the average line (red dash), which sits at 100 since 2015, the same as the start level. The price has recently turned up from low at the end of 2020. It looks and feels to be bullish for alts.
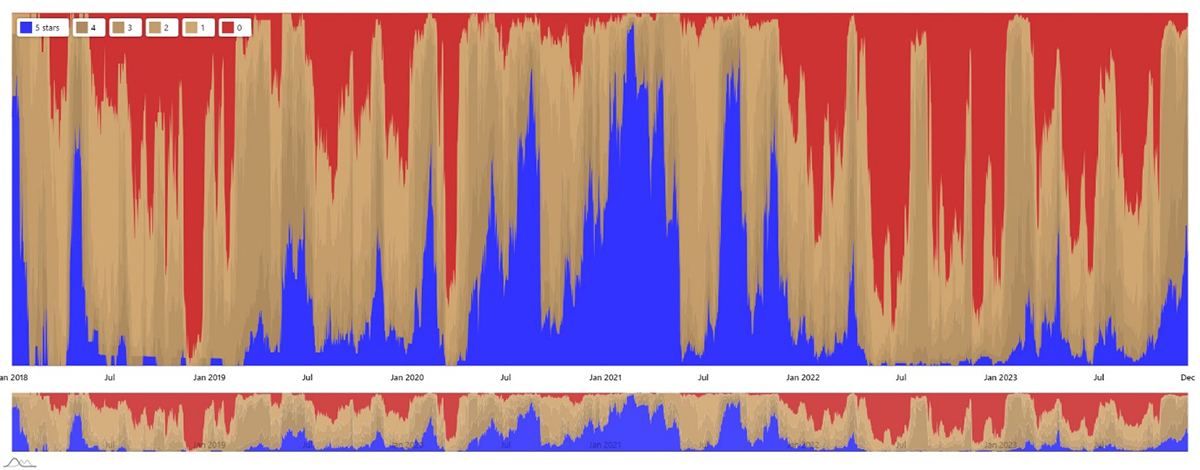
Yet the past two alt seasons both appeared the year after halving when bitcoin had already surged. Alts carried on as bitcoin stalled. Halving comes around next April, so perhaps it isn’t until 2025 that we should expect a strong alt season, but our ByteTree Crypto Average (BCA) is finally back to 5 stars, and that tells us the overall market is strong.
ByteTree Crypto Average (BCA)
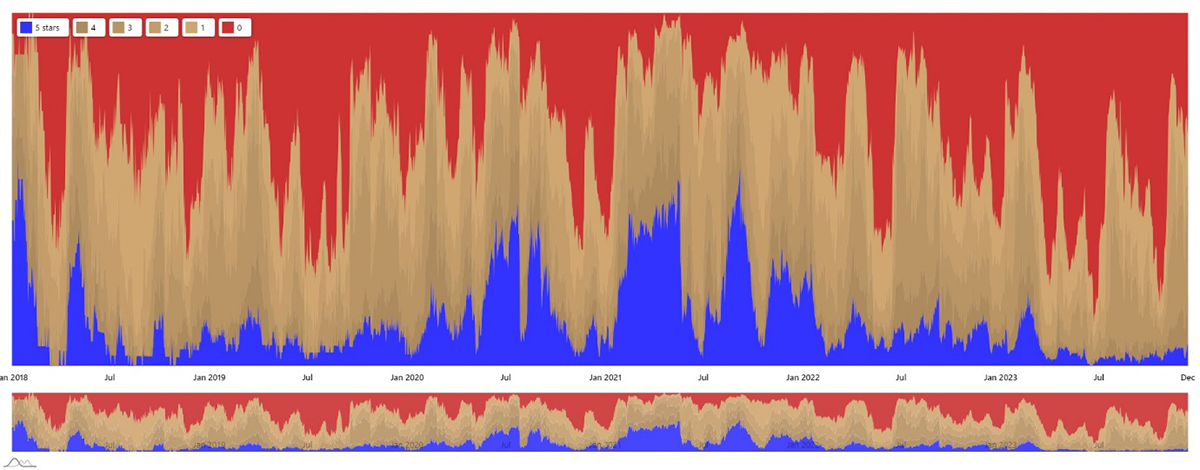
Crypto breadth is improving, with 33% of the top 100 tokens now in uptrends (blue). Just 4% of tokens are in downtrends. This is an improving picture similar to 2019.
ByteTrend Breadth – Top 100 Tokens Trend Strength in USD
We can also measure the trends in bitcoin rather than dollars. Alt season may not be here quite yet, but it’s certainly building. The downtrends are retreating, which means the altcoins are no longer lagging behind bitcoin. It’s once again, a fairer fight.
ByteTrend Breadth – Top 100 Tokens Trend Strength in BTC
Bytetrend.io has been upgraded, so please have a look. You can even follow it on X (Twitter). Each day you get a simple summary of new highs and lows in USD and BTC. Stay on top of this, and you’ll never miss the great alt rallies.
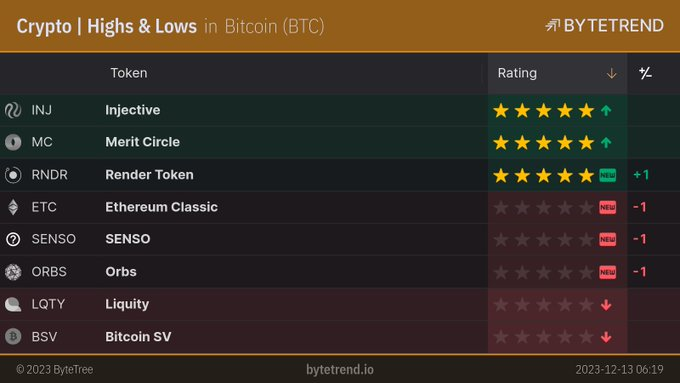
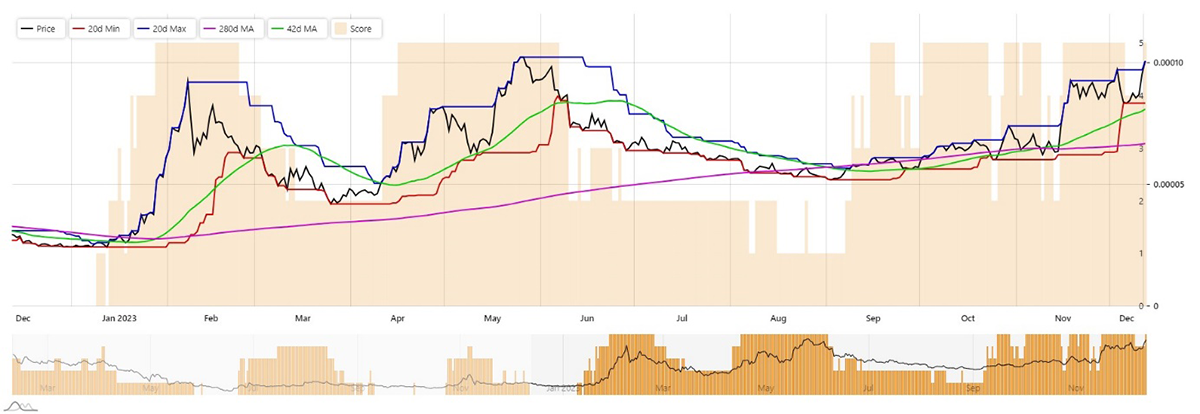
For example, Render (RNDR) has just made a new high, and the trend is back to a 5-star.
Render Is a 5-star in BTC
You could basically look at hundreds of charts each day, or a couple of tables from ByteTrend instead, where you’d be better informed.
Macro
The big macro story for bitcoin is the weakening dollar. A weak dollar is good for bitcoin and vice versa. To illustrate this, I show the chart from earlier with the dollar beneath. Bitcoin has generally been strong when the dollar has been flat or falling. This hasn’t changed, and with peak rates in sight, the dollar is softening.
Bitcoin and the Dollar
There’s much more that could be said, but the dollar is the daddy. Let’s hope the soft dollar continues.
Summary
It has been another memorable year for bitcoin with another spectacular result on the scoreboard. Next year, we have much to look forward to. Stay bullish, but at the same time, stay realistic.
Merry Christmas and Happy New Year.
Your feedback helps the team to build the best service we possibly can. Have no shame in making suggestions, and if you do not understand something, then please ask.