25 Years of British Banking

The Financial Times published a piece on European banks. What struck me was the positive headline, something I haven’t seen since pre-2007.
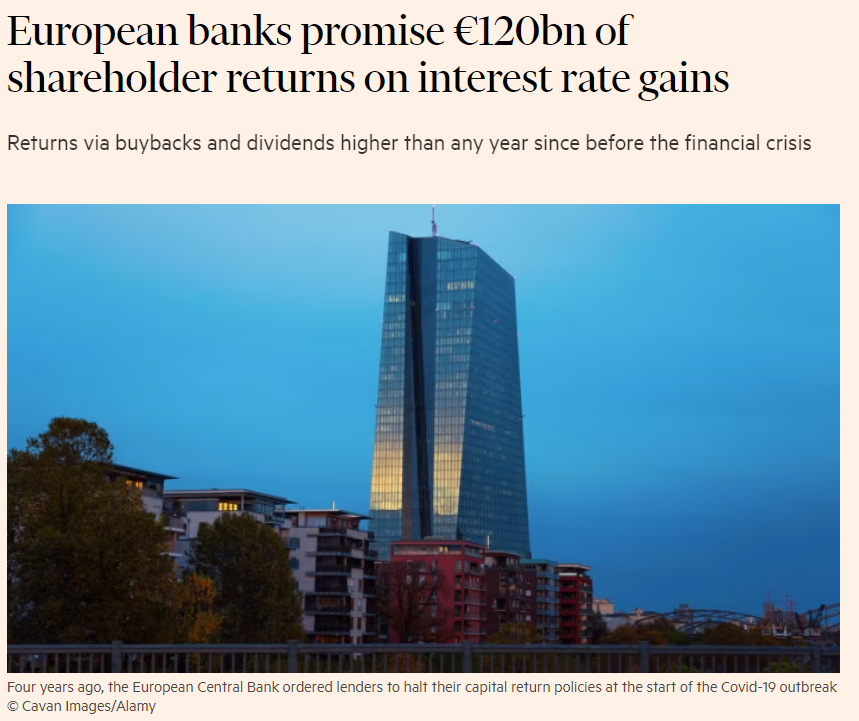
The article mentions the high profits, the super-strong balance sheets, higher dividends and more buybacks. It’s an investors’ delight and all the more surprising that the sector continues to trade so cheaply.
For the UK banks, we have come through reporting season, and in the main, they have delivered good news. It is remarkable how tightly they trade. I show them since the all-time low for long-term interest rates in 2020.
UK Banks Since the Pandemic
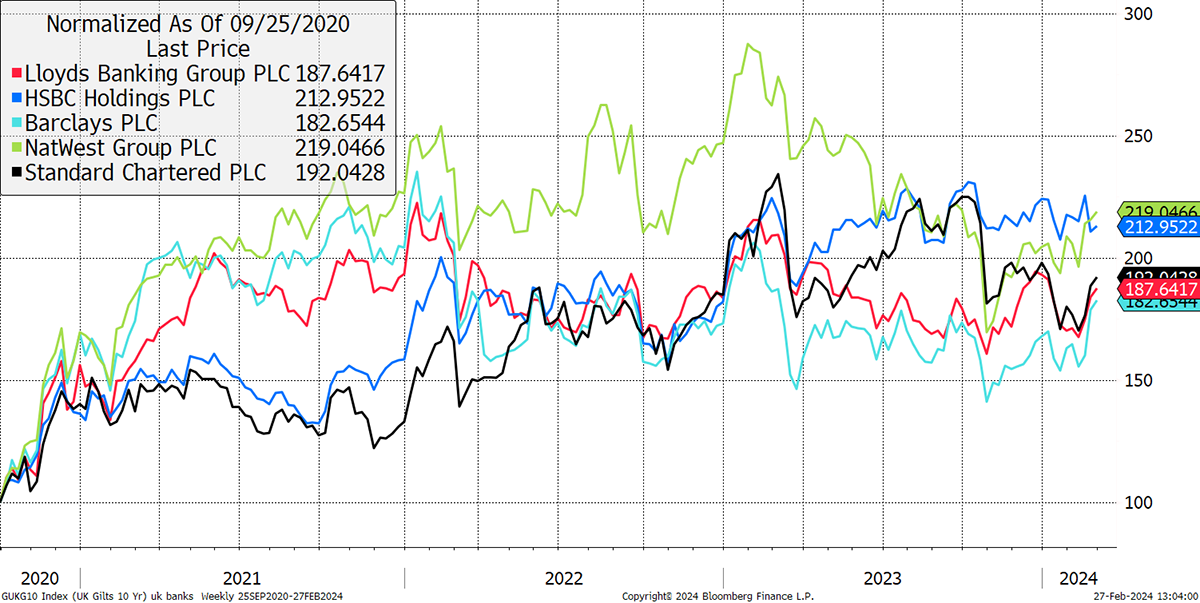
Longer-term, it’s a different story. There is a big difference between the survivors, HSBC (HSBA) and Standard Chartered (STAN), and the losers, Lloyds (LLOY) and NatWest (NWG), with Barclays (BARC) somewhere in between. The losers would have been bust without government money, while Barclays managed to wriggle its way out with help from the Middle East.
25 Years of British Banking
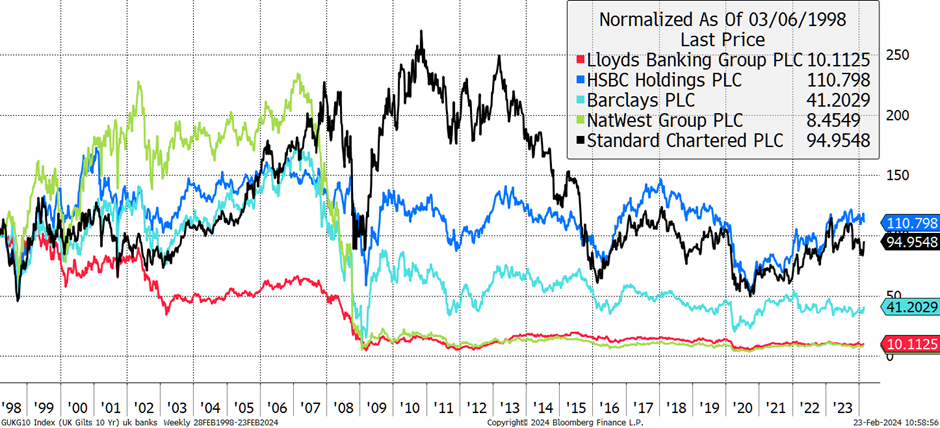
To be clear, the survivors have made no money for investors in 25 years, while the losers turned 100 into 10. It’s a similar picture across Europe. Germany, Ireland, Greece and so on had their fair share of losers, but there were also survivors in places like France and Scandinavia. There are too many to show, but when you look at the sector today, you find strong balance sheets and high profits.
There is another bonus, and this is their reaction to higher bond yields. There aren’t many sectors that enjoy higher yields, and with banks cheap and fixed, I believe it pays to own them. What is clear from the chart below is how banks performed best when bond yields were rising. That is the only time they managed to beat the stockmarket.
Banks and Long-Term Rates
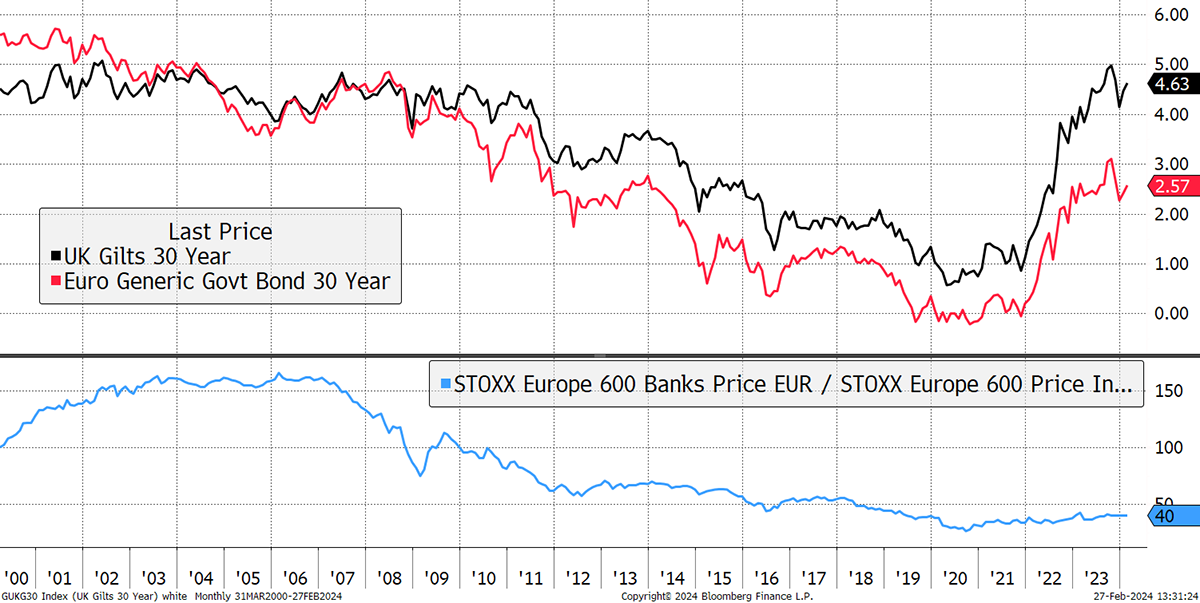
Not only do I think banks present an opportunity, but they add diversification that covers another plausible yet non-consensus scenario. That is, rates stay higher for longer, and possibly even rise from here, with buybacks supporting prices. If you haven’t carried out the suggested trade, then please take another look.
Market Concentration Risk
This chart was published in a recent note by Deutsche Bank’s strategist, Jim Reid. It’s an extremely difficult dataset to replicate because it uses hard-to-find information back to 1926. It measures the collective weight of the top 10% of companies by size as a percentage of all companies in the index at the time. An investor tracking an index would have a diversified portfolio when this concentration is low and a concentrated portfolio when it is high. The highlight is the current reading of 75% is above the 2000 dotcom boom and in line with the great crash of 1929. It’s not good news.
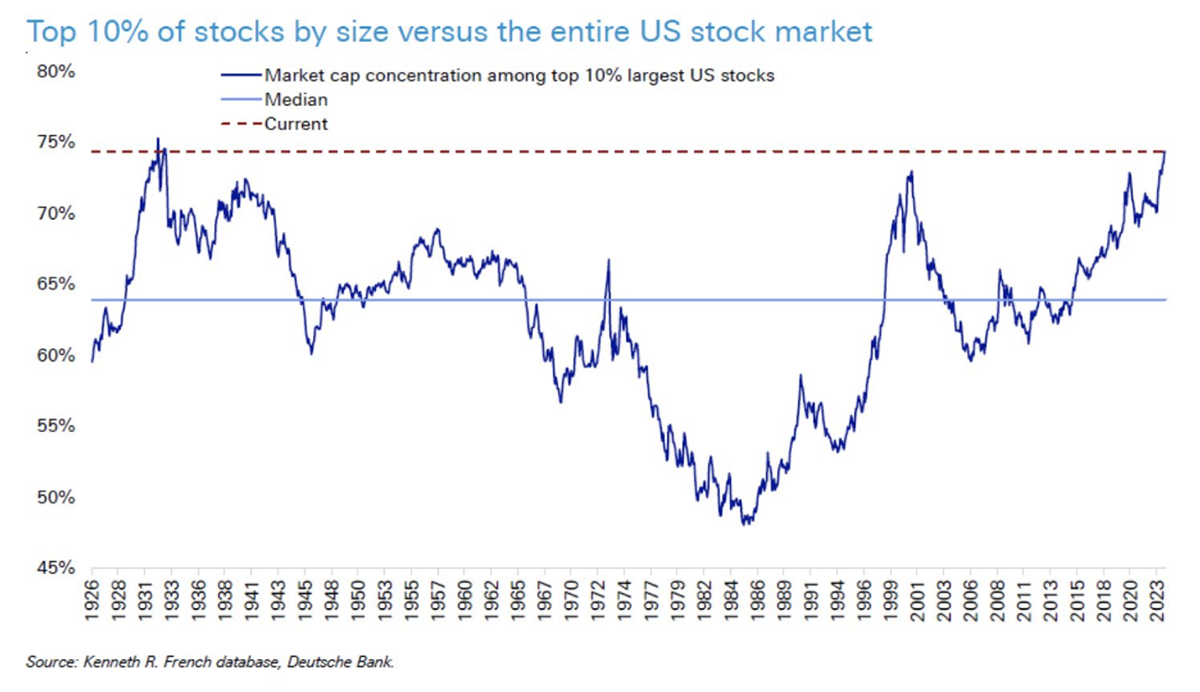
Indeed, if you look at all the peaks and troughs, they mark the highs and lows of the stockmarket. For instance, it is well known that 1972 was a bubble (high valuations, rising inflation), and conversely, 1982 was the best time in history to buy the stockmarket (low valuations, falling inflation).
We know that today’s top 10% of stocks are in a bubble, but still, we wish we owned it. That is what bubbles do to lure you in. Then pop, but when? It is important to understand that fundamental investing, which we do, is something quite different. As the big and overvalued large caps roll over, the funds raised from the sales will find their way into the anti-bubble. That’s where we are today, and I’m not budging.
The Multi-Asset Investor is issued by ByteTree Asset Management Ltd, an appointed representative of Strata Global which is authorised and regulated by the Financial Conduct Authority. ByteTree Asset Management is a wholly owned subsidiary of CryptoComposite Ltd.
General - Your capital is at risk when you invest, never risk more than you can afford to lose. Past performance and forecasts are not reliable indicators of future results. Bid/offer spreads, commissions, fees and other charges can reduce returns from investments. There is no guarantee dividends will be paid. Overseas shares - Some recommendations may be denominated in a currency other than sterling. The return from these may increase or decrease as a result of currency fluctuations. Any dividends will be taxed at source in the country of issue.
Funds - Fund performance relies on the performance of the underlying investments, and there is counterparty default risk which could result in a loss not represented by the underlying investment. Exchange Traded Funds (ETFs) with derivative exposure (leveraged or inverted ETFs) are highly speculative and are not suitable for risk-averse investors.
Bonds - Investing in bonds carries interest rate risk. A bondholder has committed to receiving a fixed rate of return for a fixed period. If the market interest rate rises from the date of the bond's purchase, the bond's price will fall. There is also the risk that the bond issuer could default on their obligations to pay interest as scheduled, or to repay capital at the maturity of the bond.
Taxation - Profits from investments, and any profits from converting cryptocurrency back into fiat currency is subject to capital gains tax. Tax treatment depends on individual circumstances and may be subject to change.
Investment Director: Charlie Morris. Editors or contributors may have an interest in recommendations. Information and opinions expressed do not necessarily reflect the views of other editors/contributors of CryptoComposite Ltd. ByteTree Asset Management (FRN 933150) is an Appointed Representative of Strata Global Ltd (FRN 563834), which is regulated by the Financial Conduct Authority.
© 2025 Crypto Composite Ltd
