The Golden Anti-Bubble

Disclaimer: Your capital is at risk. This is not investment advice.
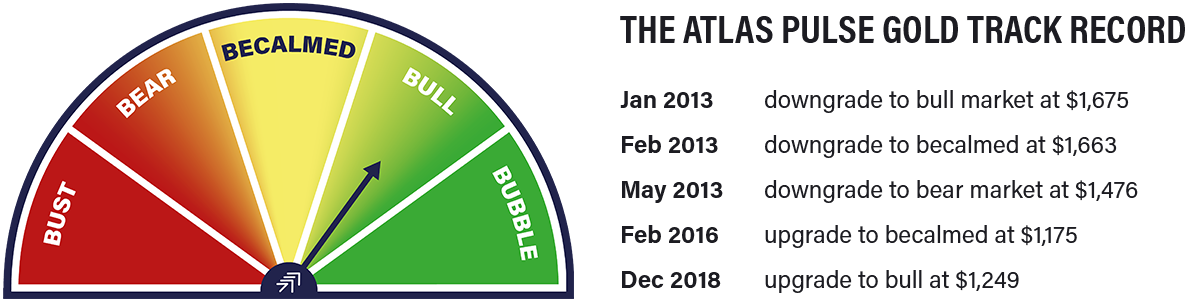
Atlas Pulse Gold Report Issue 90;
What remains a mystery is why the case for gold seems to be well underpinned, yet investors keep on selling it. It is the central banks that are most interested. Who do you think knows more?
Highlights
| Anti-bubble | Remember Dotcom |
| Valuation | What Happened to the TIPS Model? |
| Flows | So Strong, yet They Sell |
| BOLD | A Gold Accumulation Strategy |
Remember Dotcom
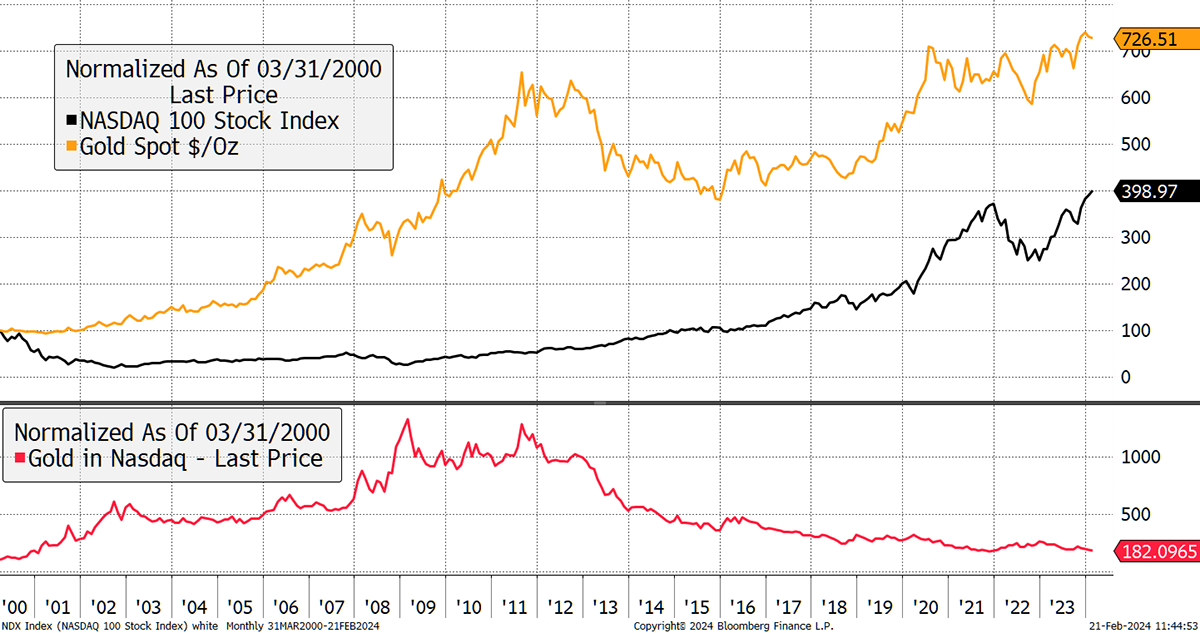
You know you are getting old when you realise the dotcom bubble was 24 years ago, and it feels like it was yesterday. The late 1990s provided a wonderful setup for gold, which had been falling since 1980. Between 1997 and March 2000, the Nasdaq surged nearly 5-fold while gold slumped. Not long after the Nasdaq peak in March 2000, gold successfully retested its low, and a ten-year bull market ensued.
Gold the Anti-Bubble in 2000
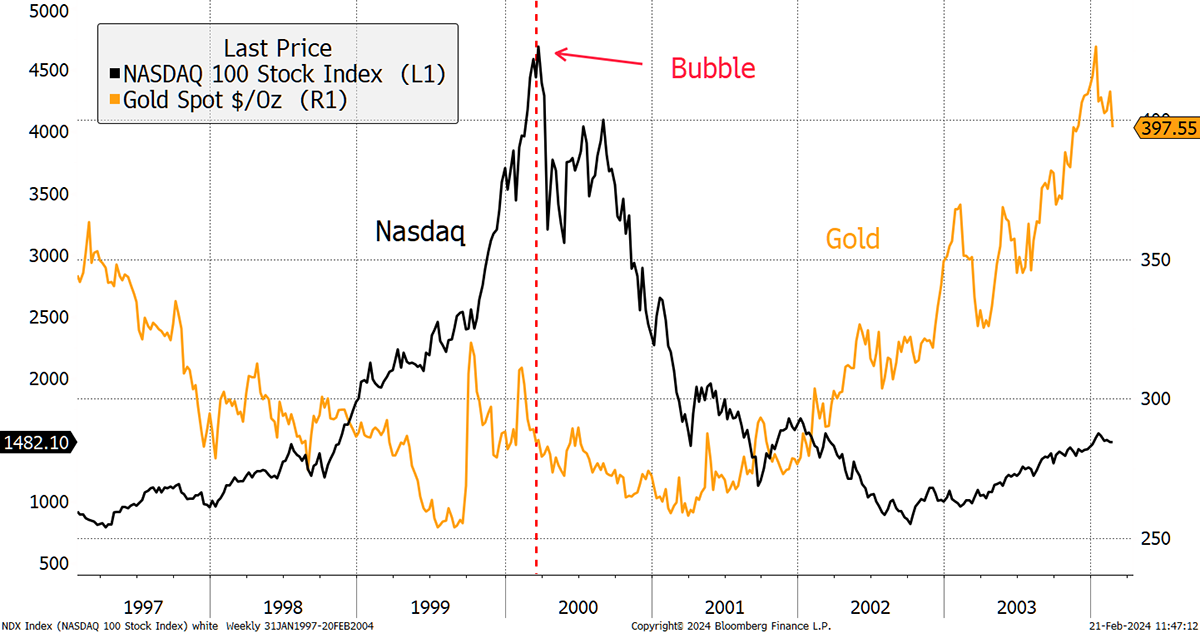
It’s noticeable how gold and the Nasdaq were uncorrelated back then. Obvious to the eye, then something changed. Today, these assets seem to have much in common, and they appear to be correlated. Can that be right?
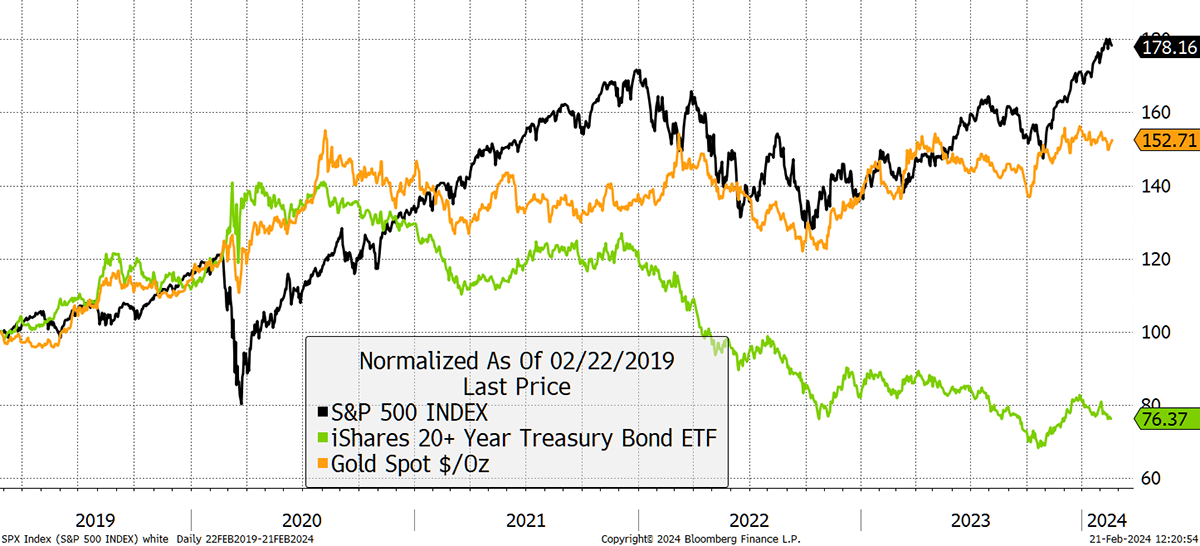
Gold and the Nasdaq Today
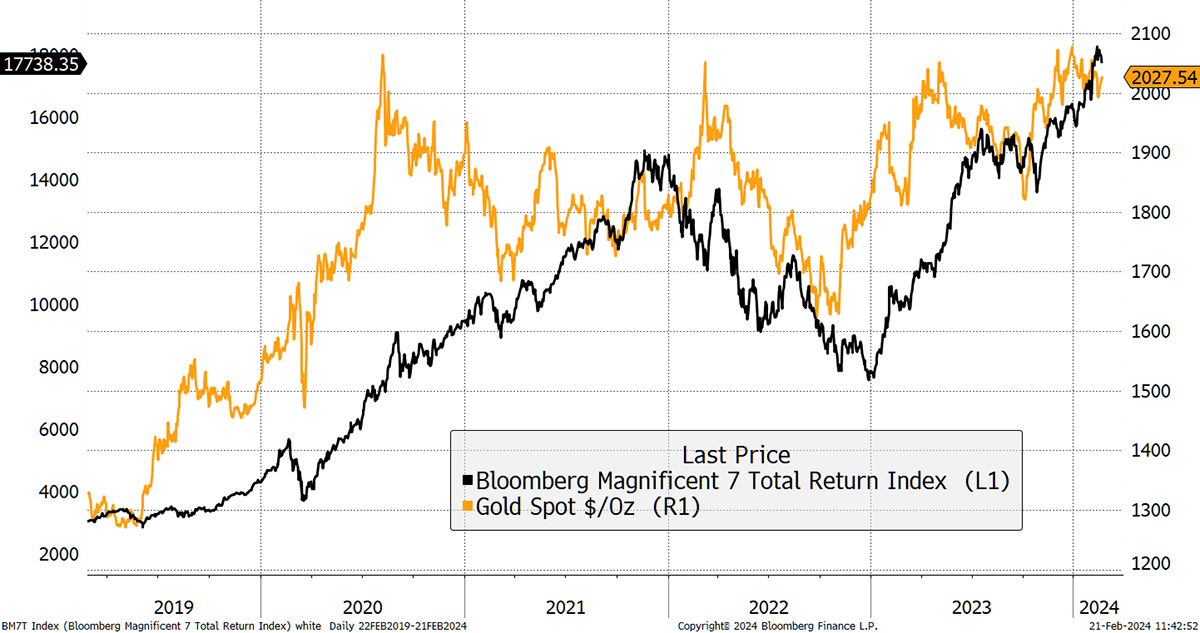
Much of the correlation can be explained by the dollar and overall market liquidity conditions. Gold and tech both fell in 2022, a time when market liquidity was tight, and the dollar surged. Then again, these days, everything seems to be correlated.
Of most importance is that something changed during the pandemic, where bonds and equities were uncorrelated on the way in, only to become correlated on the way out. Today, they remain correlated.
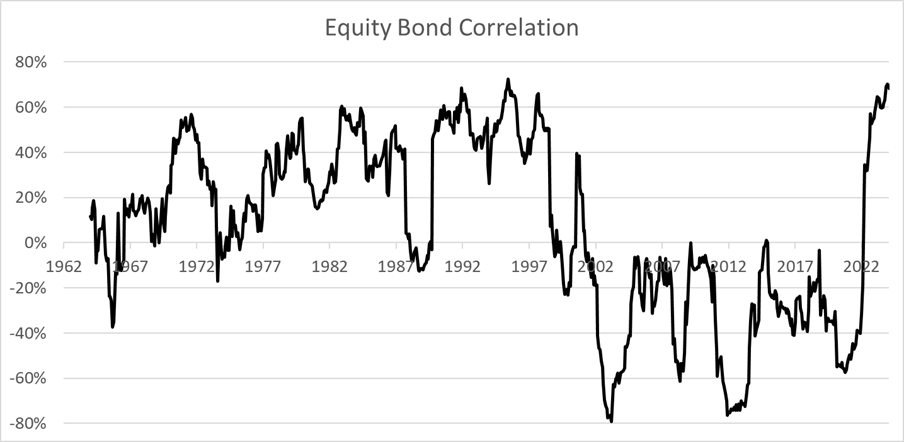
It’s hard to say whether equities and bonds being correlated is good or bad for gold. It worked out well for gold in the 1970s but not in the 80s and 90s. Then, in the noughties, gold performed well during a period of equity-bond non-correlation, but not so well in the teens.
Maybe it is irrelevant, which is a positive because we want gold to offer diversification. If it’s overly correlated to bonds or equities, it doesn’t do that. But while we are on the subject, the correlation is fairly low to both asset classes, yet it has been more of a bond than an equity over time. Besides, gold is a risk-off asset.
Bonds and Equities in Tandem
Perhaps it is not the correlation that matters as much as the potential for performance. Since the Nasdaq peak 24 years ago, gold is still ahead. The kids won’t believe it, but it’s true.
A Golden Century
Experienced gold watchers know it’s not bonds that gold mimics but TIPS or inflation-linked bonds. They reflect the difference between hugging long-term interest rates as opposed to long-term real interest rates, which are adjusted for inflation.
Physical Gold and Silver
If you are interested in buying physical gold or silver, our recommended bullion dealer is The Pure Gold Company. You can take delivery of your metal in the UK, US, Canada and Europe or leave it in their safe custody. The trading costs are low, while the quality of service is high, as shown on Trustpilot. For more details on The Pure Gold Company, please visit their website.
The model has worked extremely well in understanding gold’s short-term behaviour but has seen large divergences between 2002 and 2005 and recently.
Gold and Real Rates
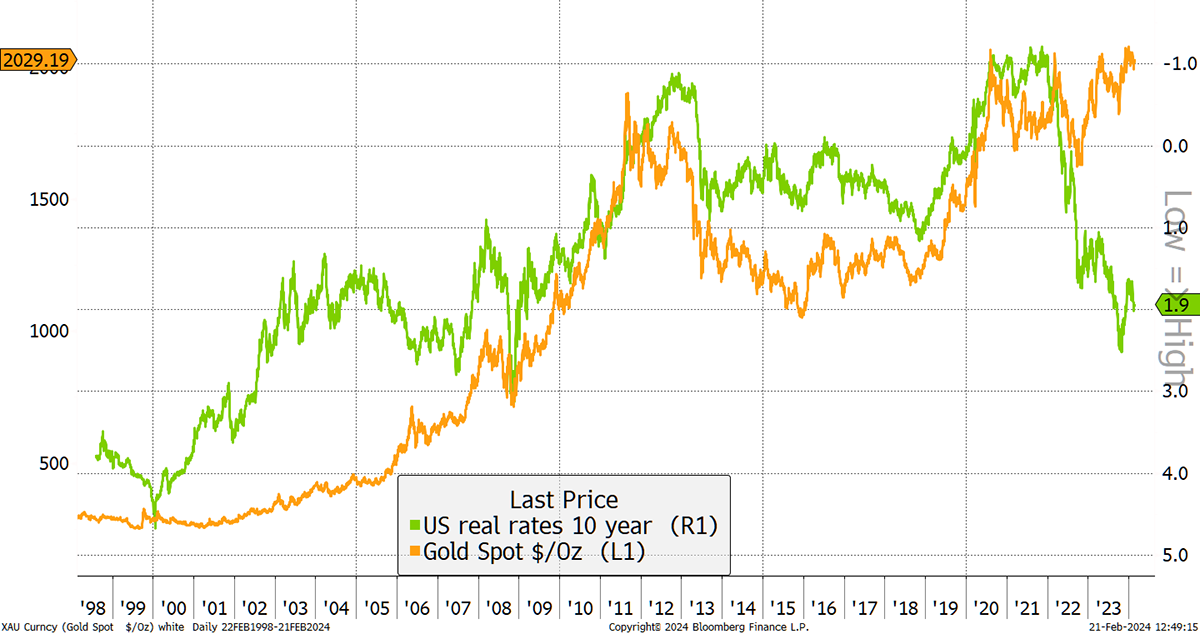
That is shown clearly using my TIPS Model. It explained most of the gold price moves from the late 1990s until the war in Ukraine. During that time, TIPS collapsed, yet gold held up. Some believe the answer is simple: gold is a currency of war. I don’t doubt it.
What Happened to the TIPS Model?
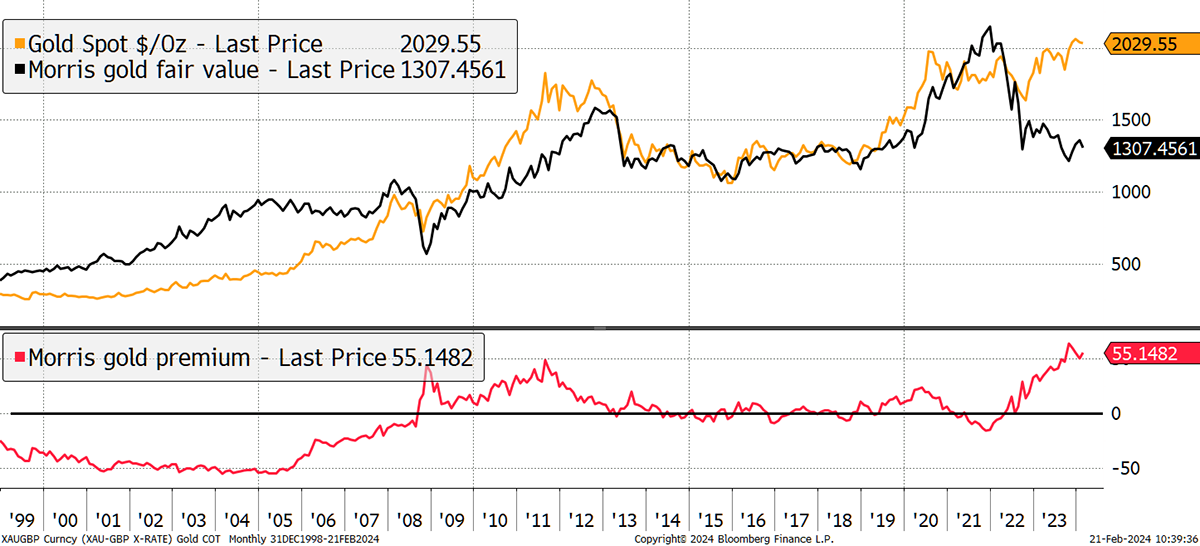
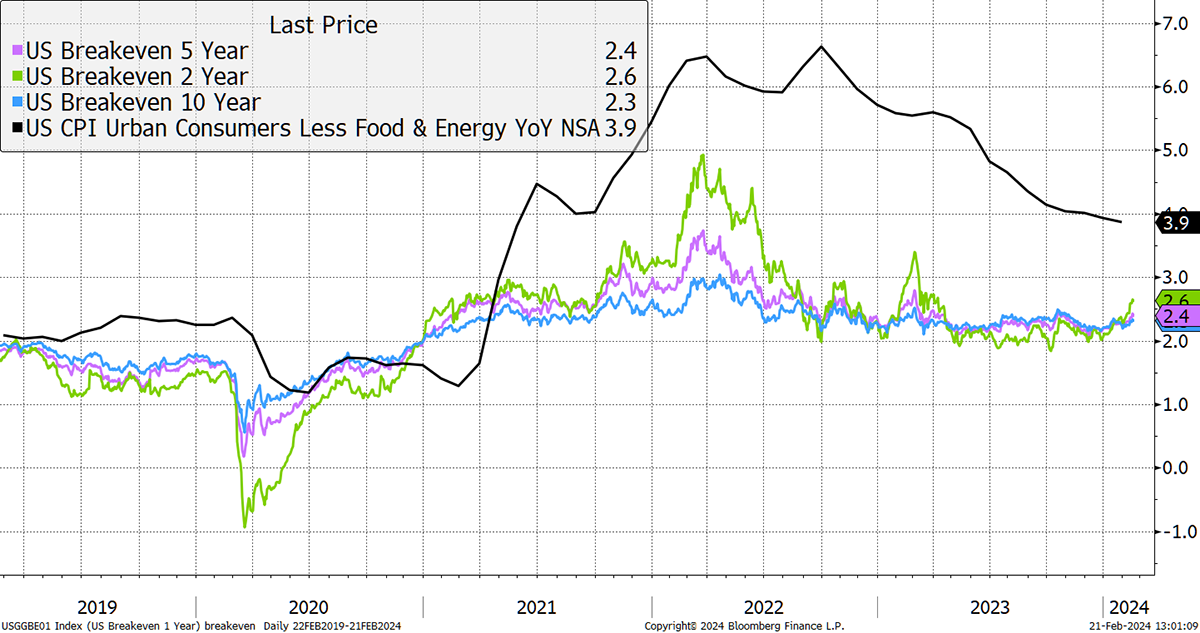
By this measure, gold is 55% overvalued, but notice how the linkage was starting to wobble ahead of the pandemic. The alternative explanation is that TIPS are mispriced, and real interest rates are actually much lower than stated. After all, inflation measures from TIPS have undershot reported inflation by a sizeable margin. Inflation expectations, or breakevens, are rising again, just as the consensus view is that inflation is behind us. Has anyone noticed this? It’s not being talked about.
Inflation Remains Stubborn
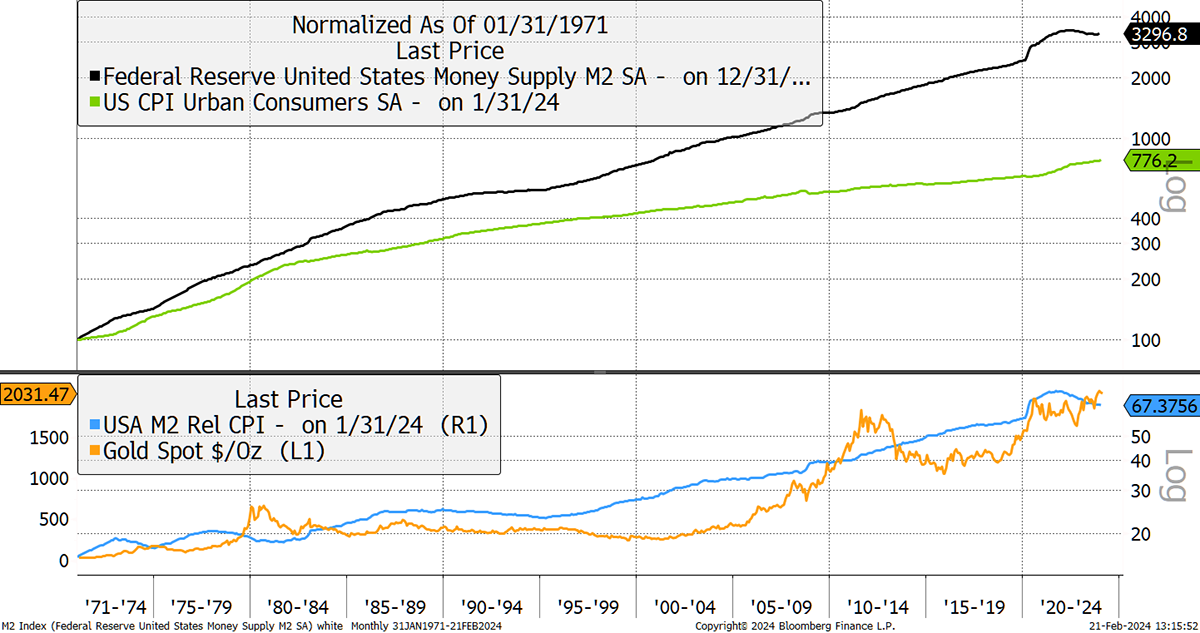
The other idea is that monetary inflation (credit and money supply) and consumer inflation (price of goods) were once similar but have diverged significantly. Over five decades, the money supply has expanded at a rate of 6.8%, whereas consumer goods only managed 4%. They are shown in black and green respectively. But notice how gold seems to follow the relationship between M2 and CPI with a lag (blue).
Monetary versus Consumer Inflation
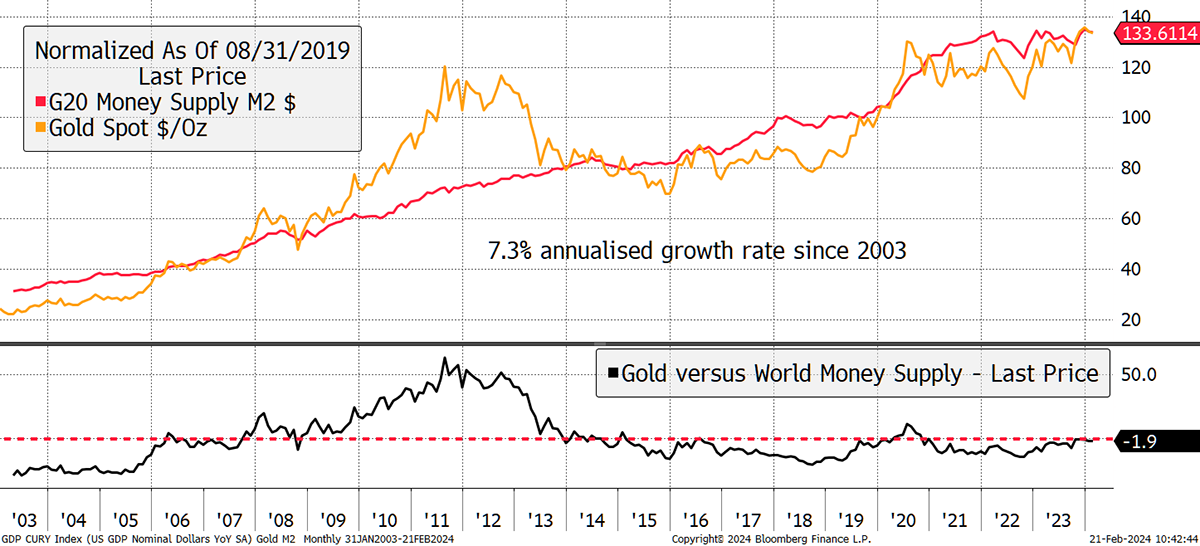
If that holds true, the next bout of money printing will prove fruitful for gold. I show it here for the G20 nations. Gold is currently in line with global M2, but sooner or later, it will have to start rising again. We always need more freshly printed money.
Gold and the Global Money Supply
It remains a mystery why the case for gold seems well underpinned, yet investors keep selling it. It is the central banks that are most interested. Who do you think knows more?
So Strong, yet They Sell
I have pointed out this chart many times before, but what is so perplexing is how investors are so wedded to the TIPS model. I have always believed that models are incredibly useful, but things change. Understanding which models to apply is more important than the models themselves. The investor interest in gold is shown by the gold held by gold ETFs. It shows you that the gold held by global investors has shrunk by a quarter.
Gold Up, ETFs Down
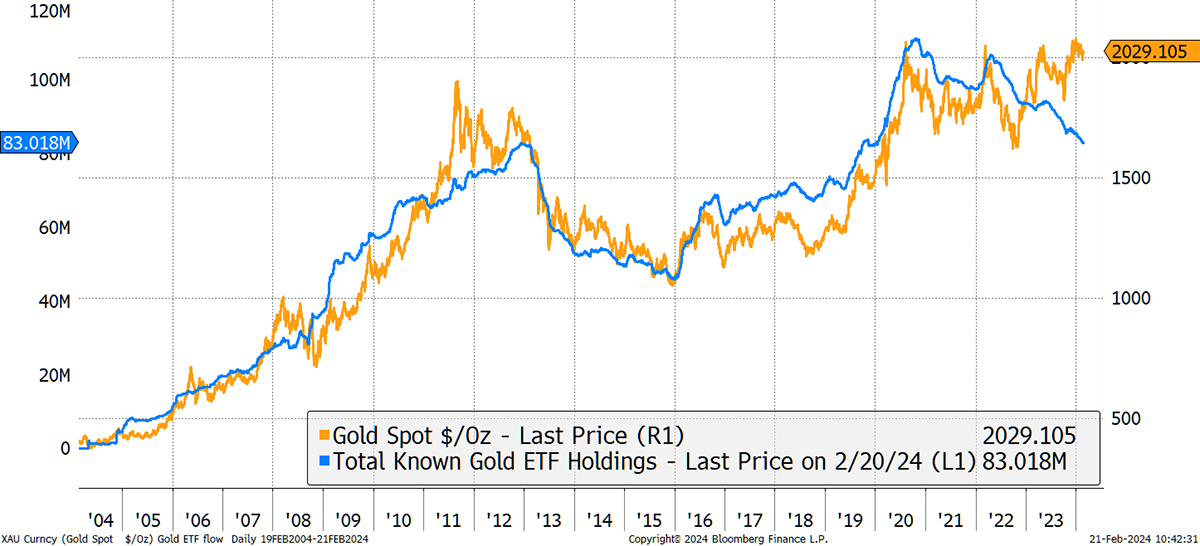
More fool them, but the point is that gold remains on the edge of an all-time high while global investors are severely underweight. Just a modest amount of buying power would see the gold price soar. And it’s high time.
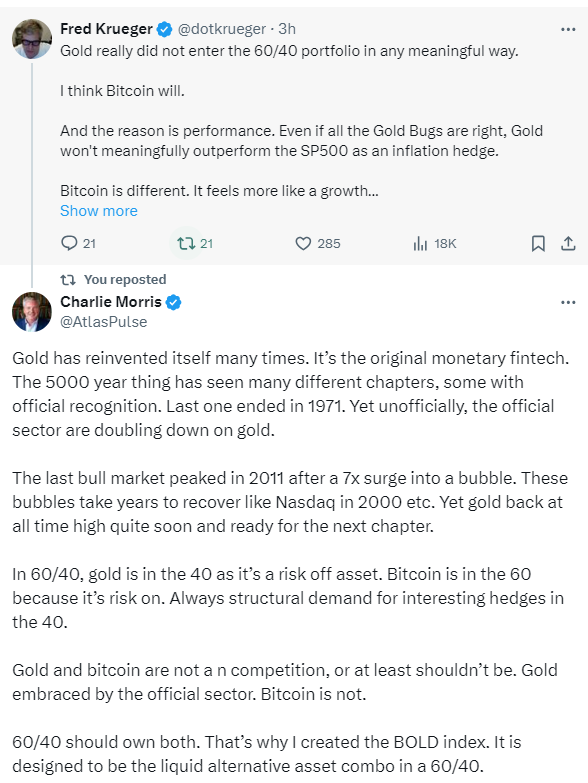
A Gold Accumulation Strategy
ByteTree’s Bitcoin and Gold Index (BOLD) effectively accumulates gold through rebalancing transactions. Consider how, in a Bitcoin bull year, such as 2021, BOLD was quietly reducing bitcoin at high prices while adding gold at low prices. Then, in the next bear year, when gold was strong, BOLD was quietly adding bitcoin on the cheap while reducing gold. That means when the new bitcoin bull run begins, BOLD is fully loaded with bitcoin, a state it would not be in had it not rebalanced.
BOLD, Bitcoin and Gold since the 2017 Bitcoin Cycle High
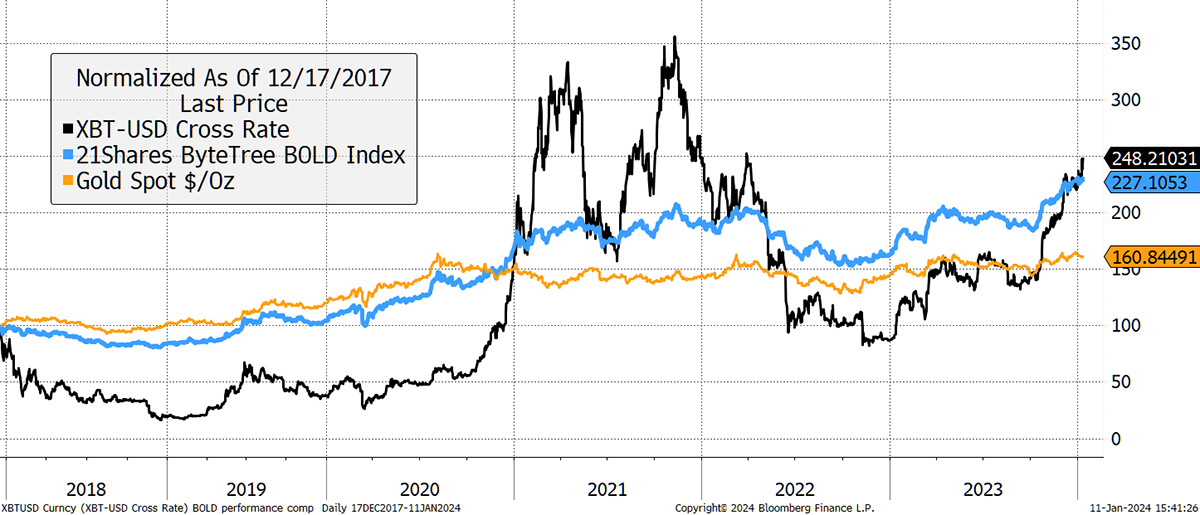
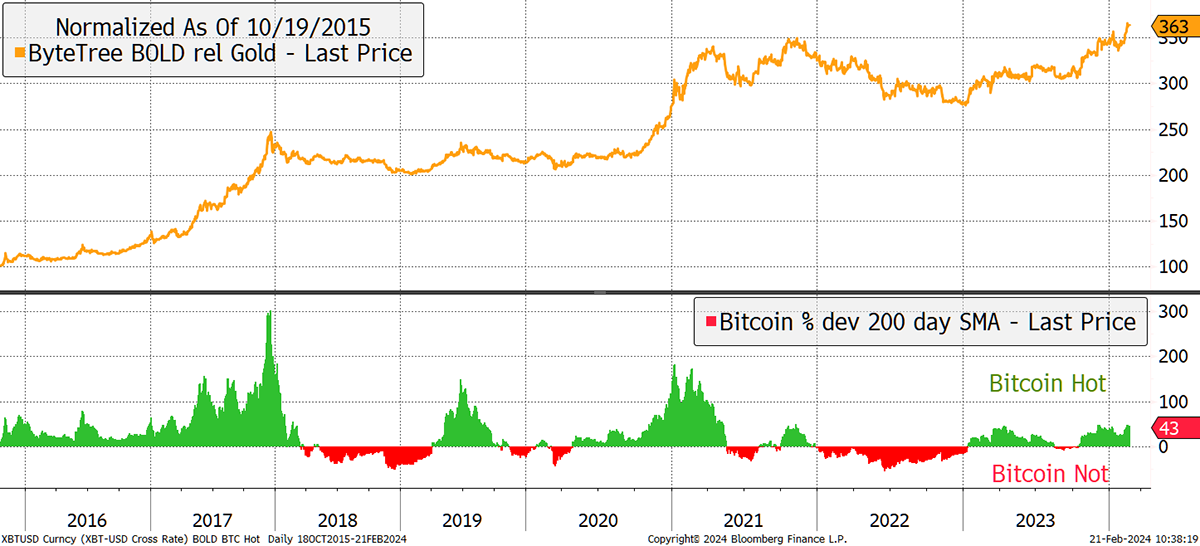
For gold fans, it gets better. BOLD has beaten gold over the years by quite a margin. What is effectively happening is the gold investor is risking a modest portion of their gold in bitcoin, which increases their gold holdings over time via rebalancing transactions. BOLD in gold just made an all-time high.
BOLD Beats Gold
To understand the basics of how BOLD works, we have a short, animated video.
The bottom line is that BOLD captures the bitcoin rallies while taking a modest level of risk.
Summary
It is a puzzle why so many investors have fled the gold ETFs. Maybe they've jumped straight into bitcoin, and perhaps the gold industry should start talking about it.
Thank you for reading Atlas Pulse, the Gold Dial Remains in Bull Market. Please let me know your thoughts by emailing me at charlie.morris@bytetree.com.