Doublings and Halvings

Doublings and Halvings

Disclaimer: Your capital is at risk. This is not investment advice.

ATOMIC 100;

So much talk about Bitcoin halvings, but what about the doublings?

ByteTree ATOMIC

Analysis of Technical, On-chain, Macro, Investment Flows and Crypto Stocks.

Highlights


Crazy Forecasts Doublings and Halvings
Technicals Weak Seasonality
On-chain Bear
Investment Flows Neutral
BOLD Is Bitcoin Down ‘coz Gold Is Up?

I last looked at this in January 2021, when Bitcoin enjoyed its 19th doubling (and third halving) since first being publicly traded in 2010. With a market cap of $1.2 trillion, Bitcoin has done one hell of a job, but we mustn’t forget that Apple, Microsoft, NVIDIA, Alphabet, Amazon, and META have all returned more, as their market caps are even higher.

The difference with Bitcoin is that it was open to the public from the early days, and so people were able to participate when it came to market with a market cap of around $150,000. Imagine that. META was the most recent company mentioned to float in 2014 at $16 billion. Those who bought the IPO were already 100,000x worse off than those who bought Bitcoin on its first trade at 6 cents in 2010.

Admittedly, we are probably talking about a very few people here, but the point is that it was possible, whereas in public companies, you’re lucky to get a look in until most of the value creation is already done. This is an important point, and one that explains the excitement behind crypto over the stockmarket. Great success is not only deemed possible but accessible to all.

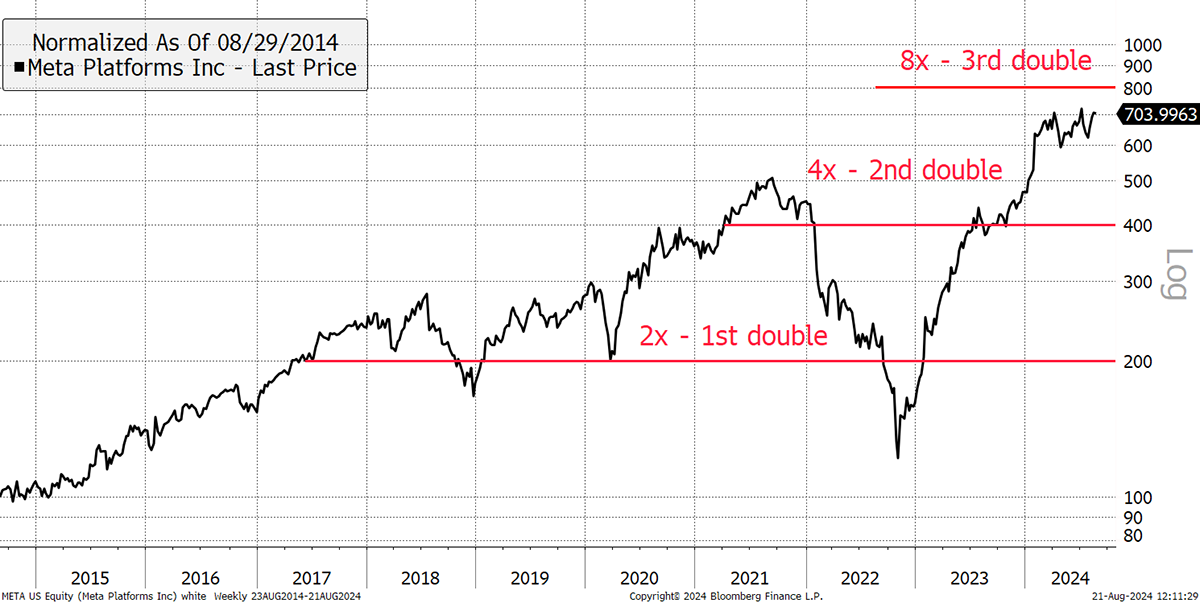
Since the IPO, META has doubled twice, and a third double would need to see the stock gain a further 13% from here. Three doubles mean 8x in capital.

META Has Doubled Twice

Source: Bloomberg

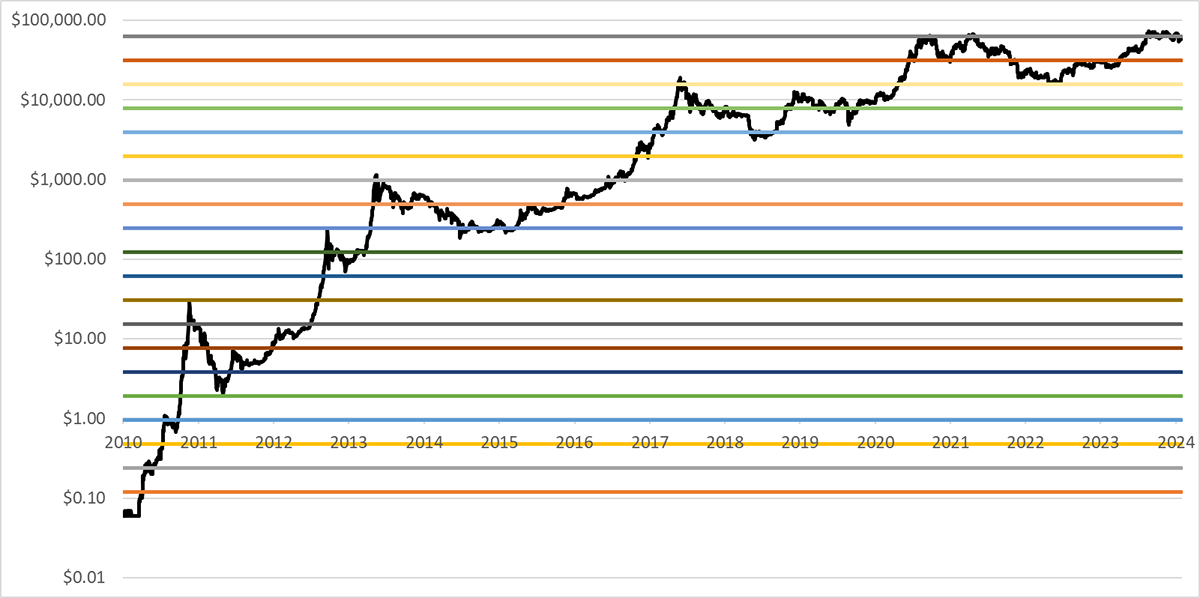
In contrast, Bitcoin has doubled 20 times, more than anything in history. It helps us visualise the game of rice on a chessboard. Sadly, Bloomberg data only shows 18 doubles, but if you could dig back into 2010, there were another two to be had.

Bitcoin Has Doubled Twenty Times – Log Scale

Source: Bloomberg

I love the parallel and even nature of the chart above, which gives no sense of time. That’s because it’s a logarithmic chart that shows doubles as equally spaced. It makes Bitcoin’s price advance seem so simple, predictable and repeatable, which has given way to many ebullient models such as stock-to-flow and, more recently, power law. But it hasn’t been plain sailing. HODLing Bitcoin has been hectic, and one of those doubles took 1,271 days (3 ½ years) between late 2013 and 2017. When plotted with a normal axis, it looks like this. It soon becomes clear that most of the doubles occurred before 2017.

Bitcoin Has Doubled Twenty Times – Normal Scale

Source: Bloomberg

Bitcoin’s 20th double took place on 13th April 2021, which was 1,226 days ago, or 45 days short of the longest wait between 2013 and 2017. In 45 days, it will be the 5th of October. Did someone say Uptober? That’s quite exciting, and maybe we’ll be due another double in Bitcoin’s strongest month of the year.

We should also consider the cost of doubling and how much inflow is required to cause the price to surge. The basic idea is that the network must balance, so if miners are cashing out, real money must fund that. I accept that not all coins mined have been sold for cash, but with high energy costs, most have. By observing price doublings against total miners’ revenue, we get a sense of the cost of doubling the price of Bitcoin.

The Cost of Doubling

Source: ByteTree, Coin Metrics

The short waits are cheaper, as there is less time for the miners to accumulate wealth, while the long ones are the costliest. The 19th doubling cost $14.8 billion of network flows, and the 20th, $3.1 billion.

The next won’t happen until the price is $125,829, with a $43.6 billion bill and climbing. Yet even the most expensive doubles have cost 10% or 11% of the total market cap, with a post-2013 record of 6%. The next doubling may well happen in October, and at 3.8% (or perhaps 4% by then), maybe that’s good value. After all, it will be creating $1.2 trillion of value.

Technicals

Here and now, the price action is weak, but things can always change for the better. We’ve had a Bitcoin death cross, with the 30-day falling below the 200-day moving average, with a ByteTrend score of just one out of five.

Bitcoin 1/5 Trend Score

Source: Bloomberg

The good news is the 200-day moving average is still rising, which means there is still an uptrend, and it is unlikely that Bitcoin will slump while this remains the case. More likely perhaps is a bounce, but what’s the catalyst other than October is a few days closer?

The Uptober thing is fascinating because, for some reason, August and September are seasonally weak, while October is the strongest month, often turning into a bullish trend. Indeed, Q3 is generally weak, while Q4 is historically by far the strongest period to own Bitcoin.

Bitcoin Returns by Month

Source: Bloomberg

Apologies for the poor quality of the table, but follow the colours to see the point.

Investment Flows

The other piece of good news is how the Bitcoin ETF flows have turned positive after a two-week stall.

Bitcoin Held by ETFs

Source: BOLD.report

It’s the heavy selling from the Grayscale (GBTC) ETF, which has now lost 359,293 BTC this year. Some of this gets recycled into other new ETFs, but when it doesn’t, it shows up as outflows.

GBTC Bitcoin Held

Source: Bloomberg

At least they are two-thirds done, and so the outflows will have to slow before too long. It is remarkable that the market has been able to shrug this off so calmly.

On-chain

The Bitcoin Network Demand Model scores 1 out of 4, which is unchanged from last month’s reading. Bitcoin’s daily fees are easing back, which suggests lower transactional activity.

Daily Bitcoin Fees

Source: ByteTree, Coin Metrics

Yet the number of daily transactions remains stable.

Daily Bitcoin Transactions

Source: ByteTree, Coin Metrics

And the dollar value passing through the network aligns with a fair value of $63,748 (red), which is slightly above the current price.

Bitcoin Fair Value

Source: ByteTree, Coin Metrics

BOLD

While Bitcoin has remained soft since March, gold has made a new all-time high. Yet Bitcoin is still the winner in 2024, with BOLD just behind.

BOLD in 2024

Source: Bloomberg

But since the last Bitcoin Doubling on 13th April 2021, things look very different.

BOLD Since Bitcoin’s Last Doubling

Source: Bloomberg

If you would like to learn more about BOLD, then please have a look at the BOLD.report website.

Summary

I remain of the view that there’s normally a post-halving hangover as seen in 2016 and 2020. This time is somewhat worse because the ETFs brought forward a hype cycle. While they are welcome development for Bitcoin’s long-term progress, the cooling off period isn’t over yet.

Bring on Uptober, and thank you for reading the 100th issue of ATOMIC.


Charlie Morris is the Founder of ByteTree and Editor of ATOMIC. Fascinated by the emergence of a new asset class, but unsure how to make sense of it, he started to analyse the Bitcoin blockchain in 2013.

Charlie has 25 years of fund management experience and is a pioneer of multi-asset investing. At HSBC Global Asset Management, he launched the Absolute Return Service in 2002, which grew to over $3 billion. Much of that success came from moving away from the crowd and embracing a wider range of asset classes that traditional investors were not familiar with at the time.

We very much welcome your comments and feedback. Help us improve our service by contacting us at atomic@bytetree.com.