

Atlas Pulse Gold Report Issue 96;
Various macro experts doubt the gold trend because “positioning is too high”. I just don’t see it… While investors have largely missed this gargantuan gold rally, the central banks have bagged it.
Highlights
| Technicals | Resounding All-time High |
| Positioning | The COT Longs Lag the Trend |
| Silver | On a 600-Mile Charge |
| Macro | Dollar Bear |
| BOLD | Bronze, Silver, Gold, BOLD |
Technicals - Resounding All-time High
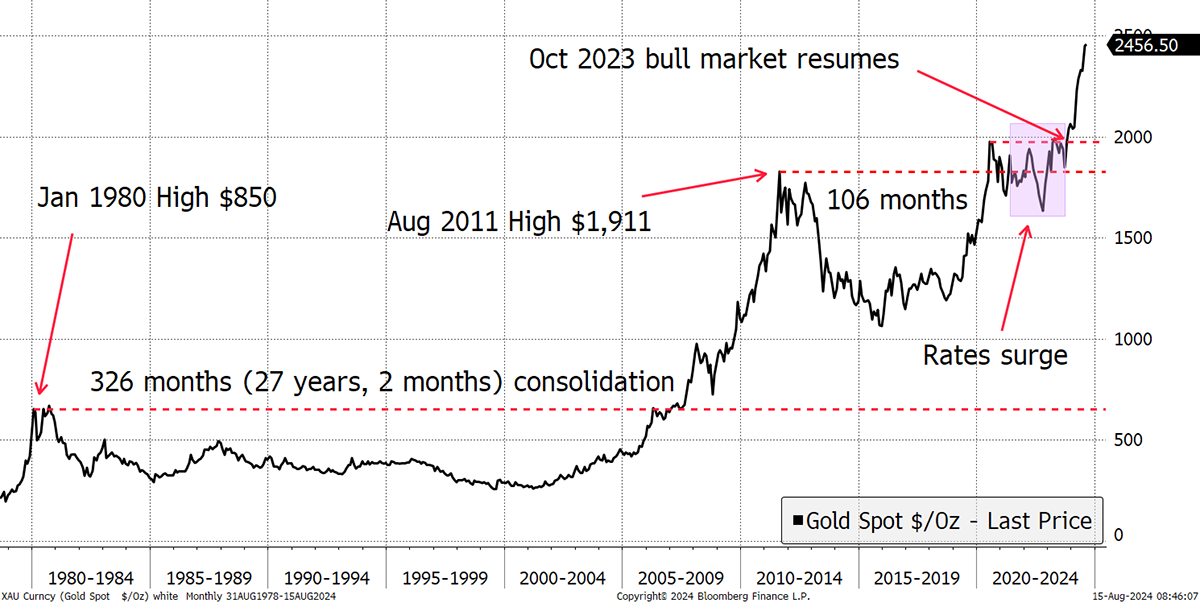
So many gold doubters but there’s no doubt in the trend. I show the gold price since the late 1970s and how it took 27 years to reach a new high in 2006/7. Then the price surged to $1,911, before consolidating for nearly nine years, to the pandemic high in mid-2020. Gold then fought off the rate hikes, against the odds, and is making progress. It’s a booming, yet contrarian trade, because it is so quiet.
50 Years of Gold
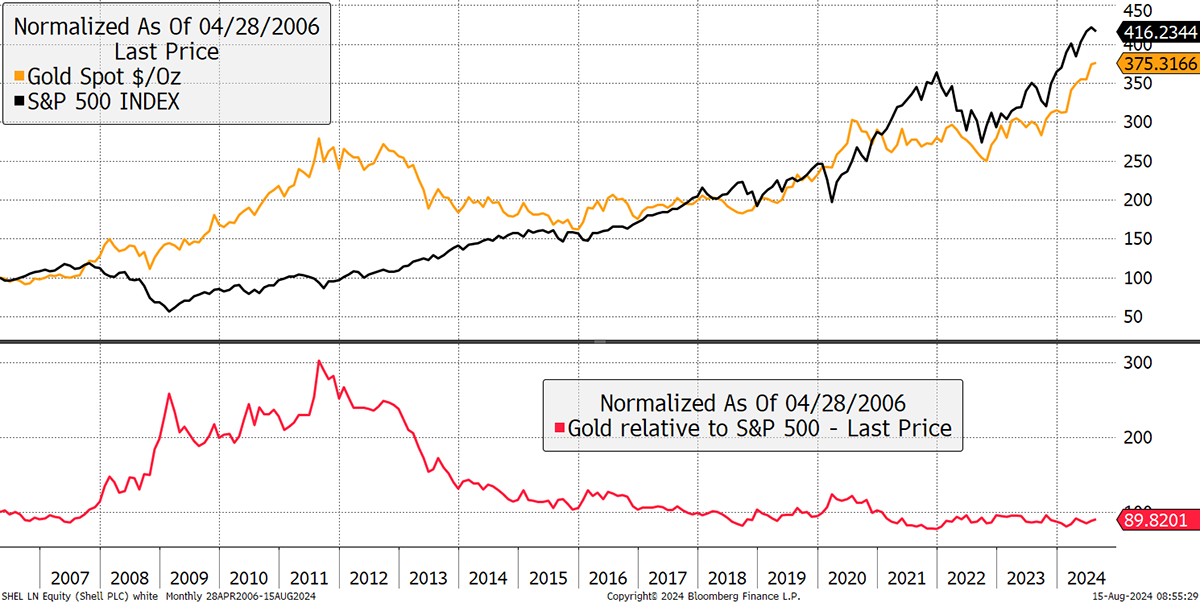
Starting from the new era in 2006, gold has lagged the S&P 500, but not by much (dividends excluded), as shown in red. It is remarkable how these two assets work against each other, distinctly demonstrating the natural power of gold as a portfolio diversifier. It’s clear to the naked eye.
Gold and Stonks
Yet I have read various macro experts doubt the gold trend because “positioning is too high”. I just don’t see it.
Positioning - The COT Longs Lag the Trend
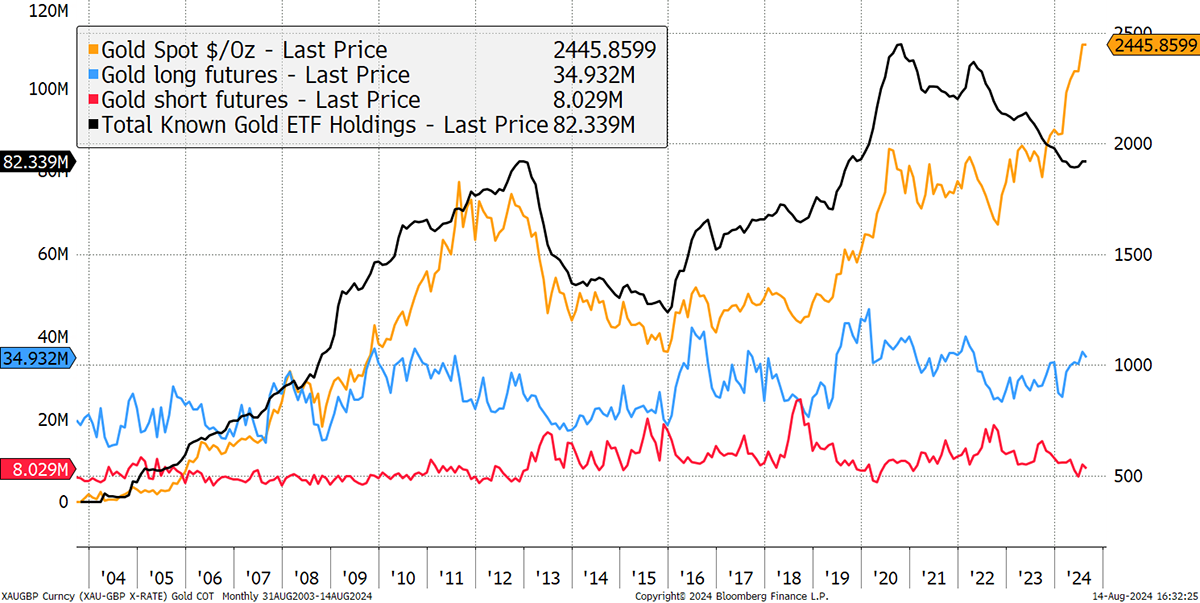
The ETFs only hold as many ounces of gold as they did in 2013, before the crash. They are rising again, which is great, but there is a long way to go before you might deem gold to be a crowded trade. Then there are the longs in futures (COT longs), which are high, but not that high, while the COT shorts are behaving randomly, as they often seem to do. Besides, they are a small sample of just 8 million ounces (moz) compared to 34 moz for the longs and 82 moz for the ETFs.
Gold Positioning – ETFs and Futures
I believe many investors give too much weight to the COT data despite it being far less significant than the ETF flows. They see the longs at high levels reflect excessively bullish sentiment, which it can do, but doesn’t have to. It could just be a genuinely bullish situation with a good chart. More importantly, the COT simply reflects the strength of the trend and even lags at that.
I can demonstrate this by overlaying our trend score from ByteTrend.io over the COT longs. A score of 5 reflects a good chart that is going up, and a 0, a bad chart going down. It is pretty clear that the COT data follows the trend scores and lags behind.
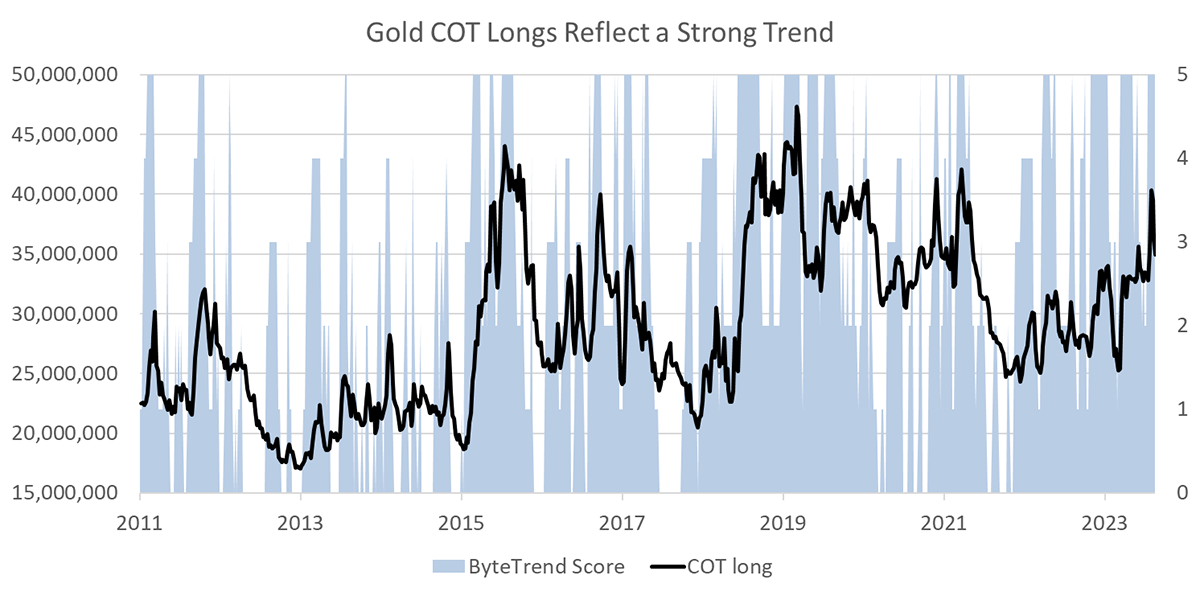
Futures contracts naturally cancel each other out, and so the longs are a measure of the actively managed funds, most of which are trend followers (jargon alert - managed futures, CTA, macro hedge funds). They buy more gold futures when the trend is strong and sell when it is weak. Hence the long futures correlate with trend strength.
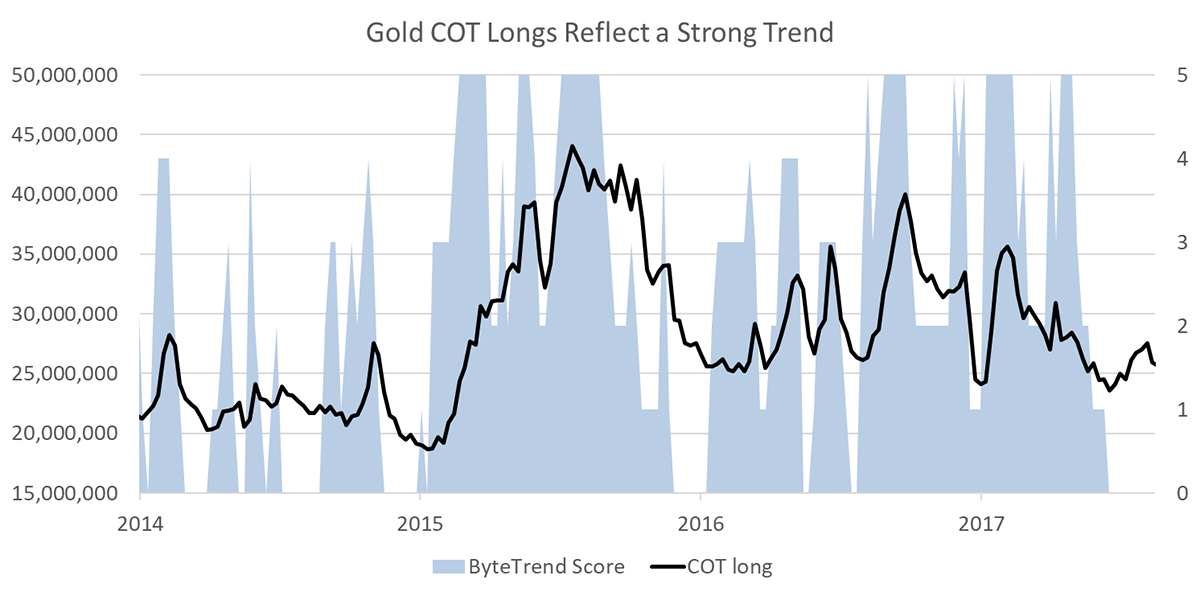
Zooming in on the 2014/6 era, the longs lagged ByteTrend on all occasions. Notice the surge in 2015 and how ByteTrend scored a 5 signal way ahead of the funds’ positioning. It was the same on the way down too.
More recently, this has been repeated. Low positioning reflects a weak trend as seen in 2022. As the trend improves in 2023/4, the funds increase their exposure to gold.
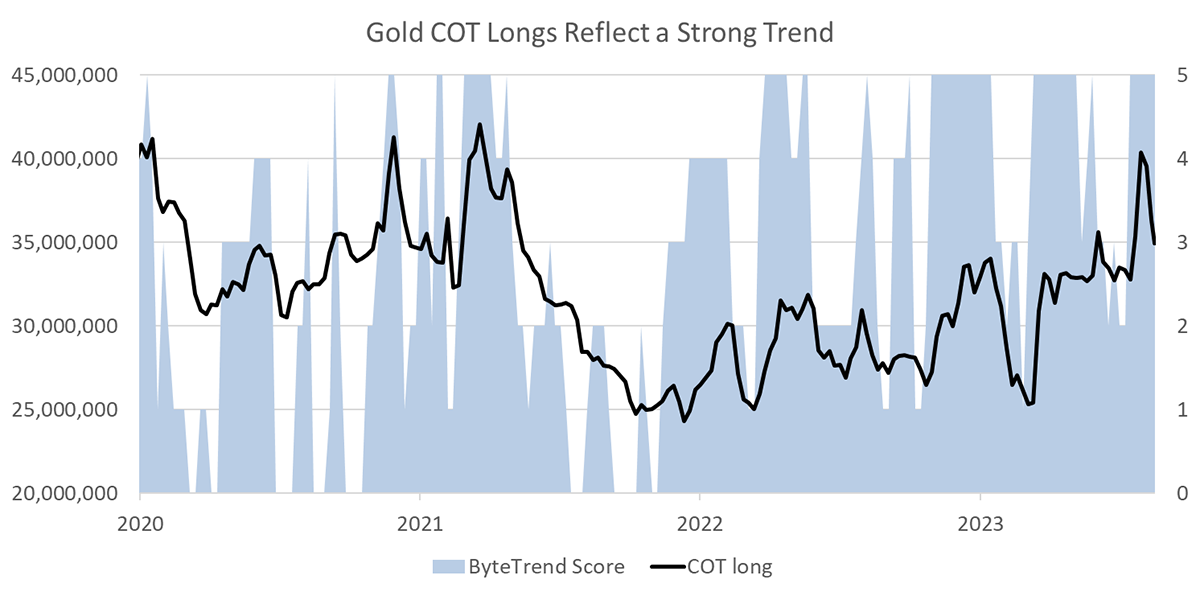
The COT poisoning data is basically useless, as the price chart tells you the same thing, but as it happens. In addition, the shorts are too small to make a difference to the gold market.
In this chart, I add the ETFs to the longs and subtract the shorts to give the overall financial exposure to gold. The market owns 109 moz, which has historically been tightly correlated with the price. Yet in the last couple of years, there has been a divergence.
Gold and Total Investor Positioning
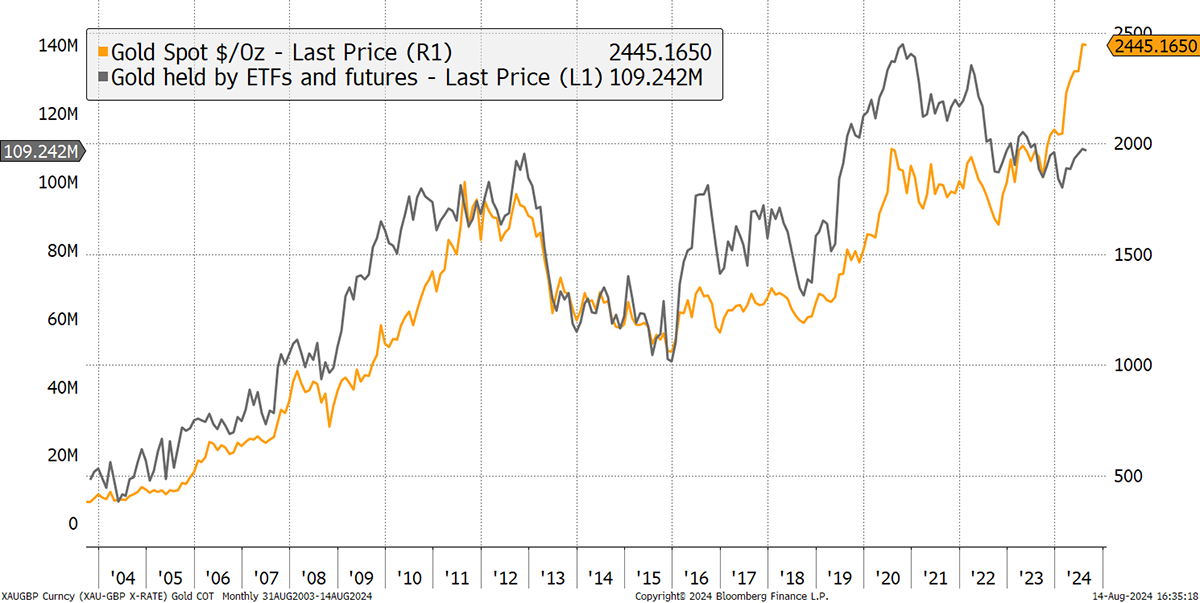
This same chart has the difference between the lines shown in red below. Gold has surged despite weak investor flows since 2021. In hunting around for an explanation, the only credible explanation comes from the central bank gold flows. While investors have largely missed this gargantuan gold rally, the central banks have bagged it.
Gold and Total Investor Positioning – it’s the Central Banks
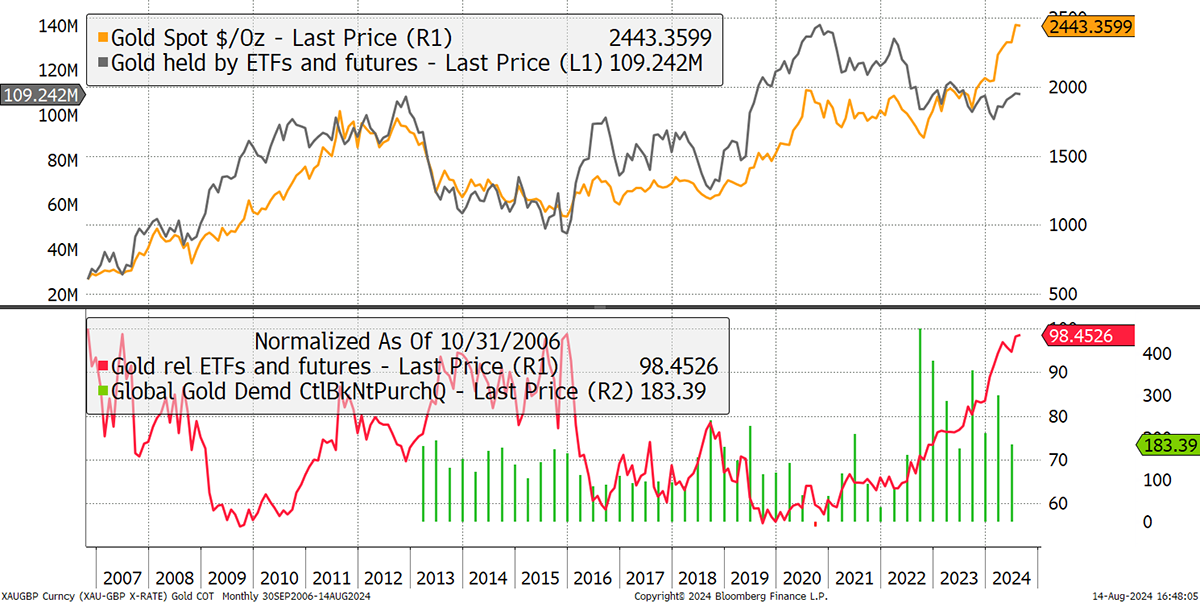
I have been focusing on this in recent months and years, and currently, central bank demand remains the single most important driver of the gold price.
Silver – On a 600-mile Charge
Kevin Bambrough (X handle @BambroughKevin) cited a piece on Samsung’s new solid-state battery, which enables a car to drive 600 miles on a single charge. The batteries have a 20-year life, and charge in nine minutes. Best of all, they require silver and plenty of it.
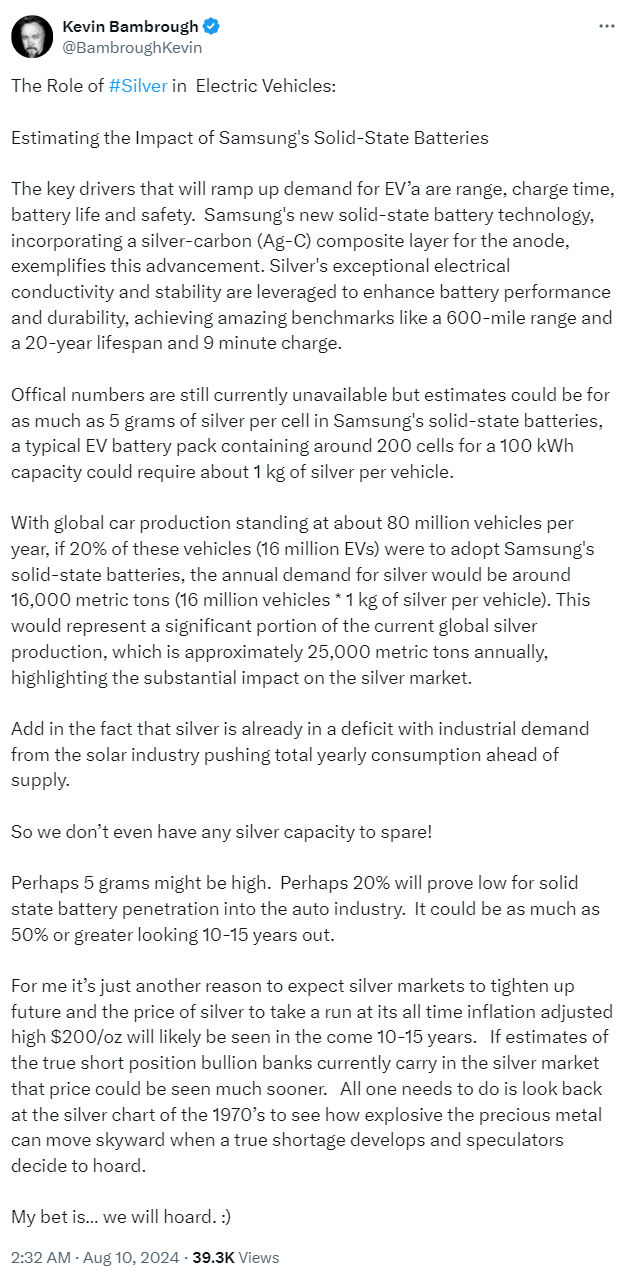
This reminds me of the silver rally of 2010, which saw the price surge to $50 on the back of demand for solar panels. The slump that followed was weighed down not only by a weak gold market but also by substitution, something that has killed many commodity rallies.
The Silver Solar Boom
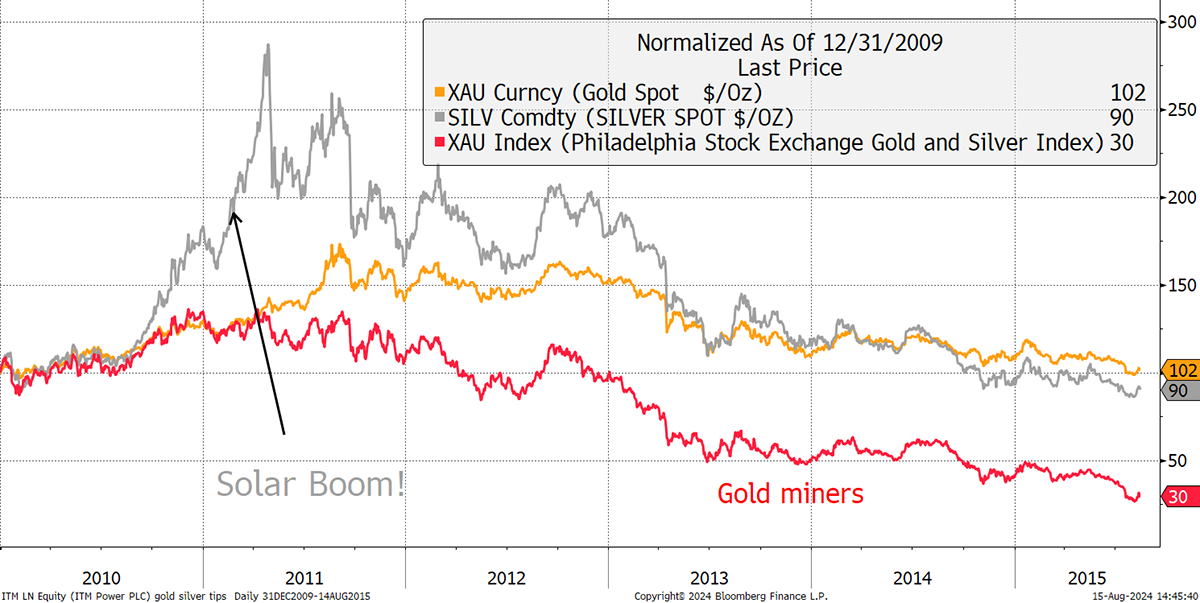
Yet the EV bull story is here and now, and if solid-state EV batteries can invigorate the crowd, silver is onto a winner. The silver price basically matches gold, but goes further not just in bull markets, but whenever there’s a good story. I like this one, and thanks Kevin for bringing it to my attention.
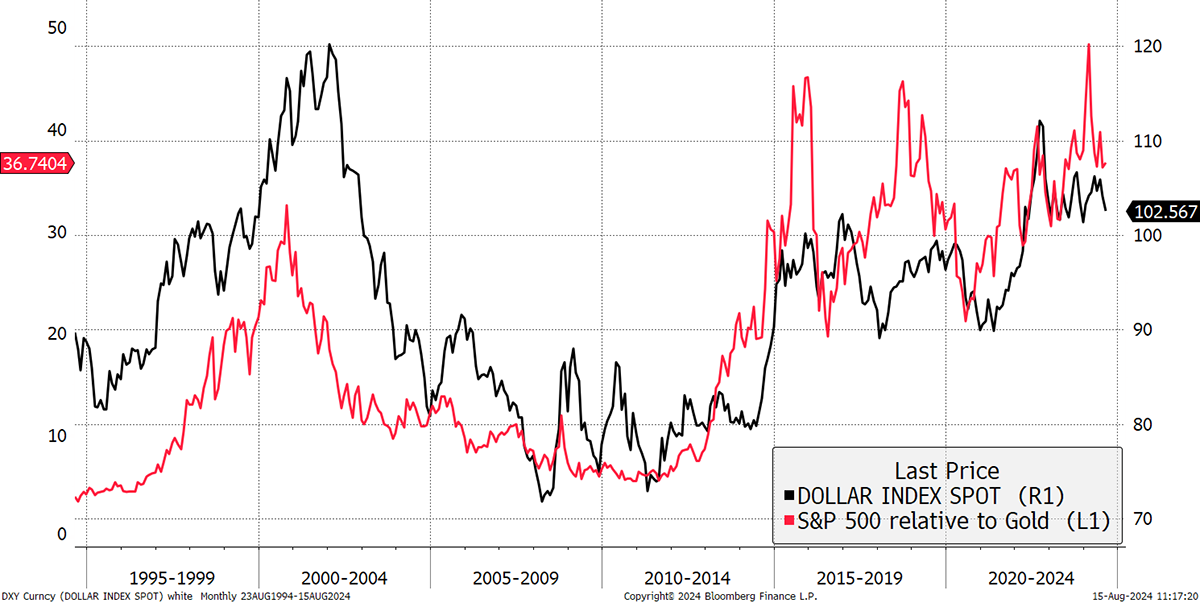
Macro – Dollar Bear
I haven’t mentioned last week’s flash crash or the yen, mainly because ByteTree clients have heard enough. More to the point, they are long Gold and the Yen, and therefore had a cushion of sorts in the recent malaise. Yet one key reason that the crash came to a halt is the weak dollar. To get a 2008 or 2020-type crash, we have typically seen the dollar surge. This time we didn’t, and the dollar is flagging a downtrend.
Dollar in a Downtrend
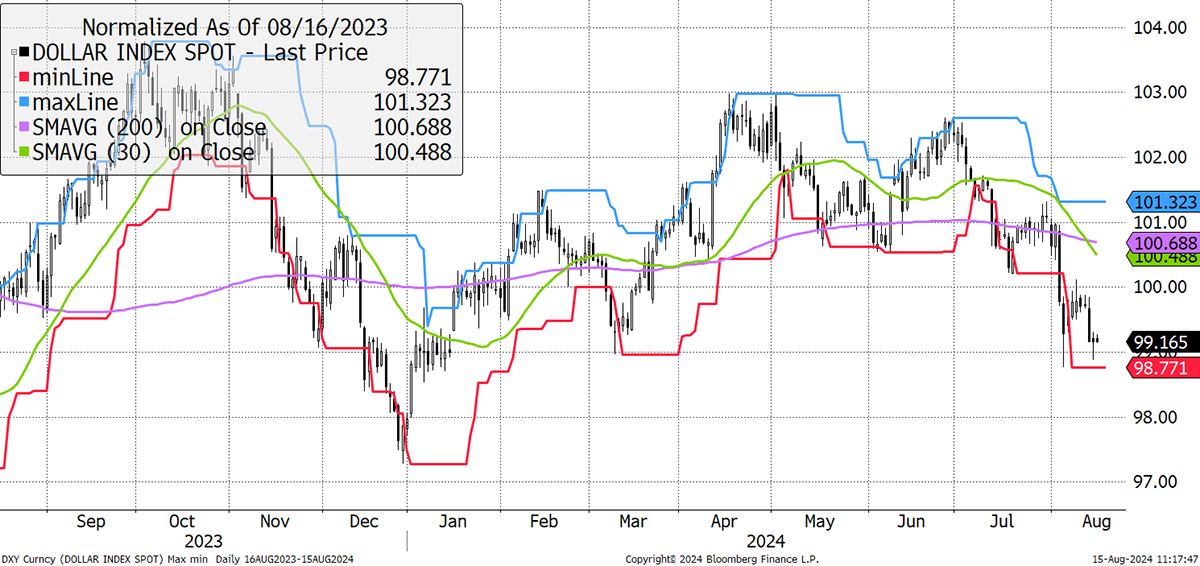
Dollar downtrends are generally good for gold, commodities and the world ex-USA. My career got going in the 2001 to 2008 era, which saw the dollar fall by a third, and the S&P 500 slump, while everything else seemed to go up. I’ve been like a parrot on this, but it strikes me that we are overdue a repeat era. A dollar bear would certainly help, as would a more buoyant Chinese economy. It’ll come and unlock huge amounts of value around the world.
Be patient.
The S&P 500 vs gold (normally the way around) is shown against the dollar index. Gold should beat the S&P as the dollar slide continues. It’s a repeatable habit.
A Weak Dollar is a Boom for the World ex-USA
The dollar is soft because the US has high debt and deficits, and they are not alone. But they are the biggest, and the dollar is super expensive on a purchasing power basis. A sustained dollar bear is going to happen, but when?
A Rich Dollar
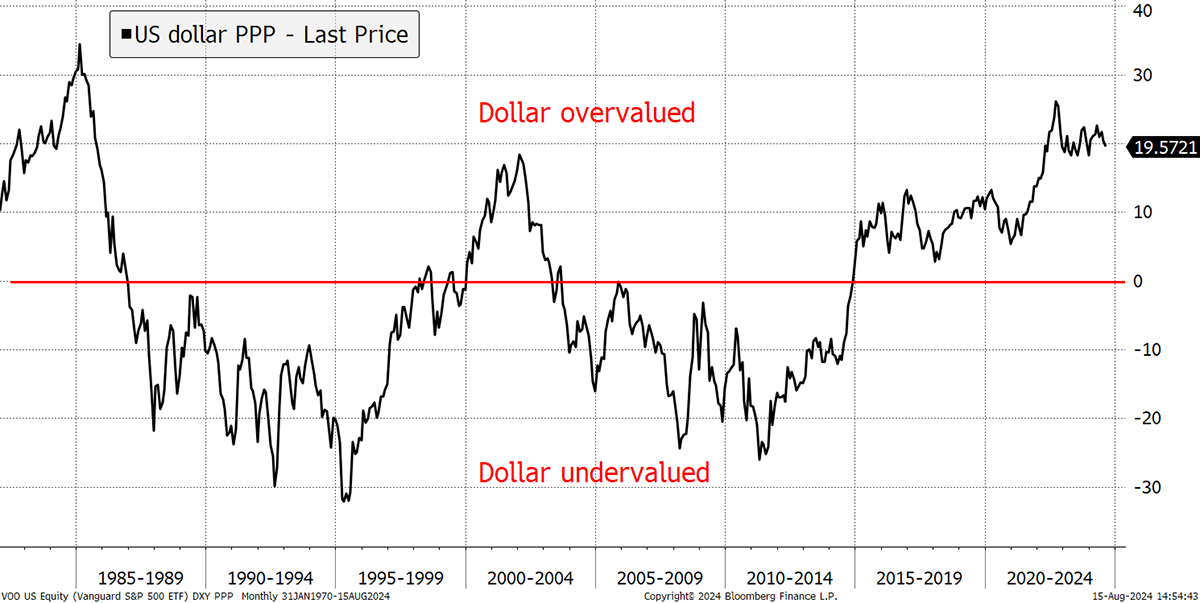
The USA can keep the deficits going for many years to come, but something must give. The choice is the economy or the dollar? Presidents generally choose the later.
BOLD - Bronze, Silver, Gold, BOLD
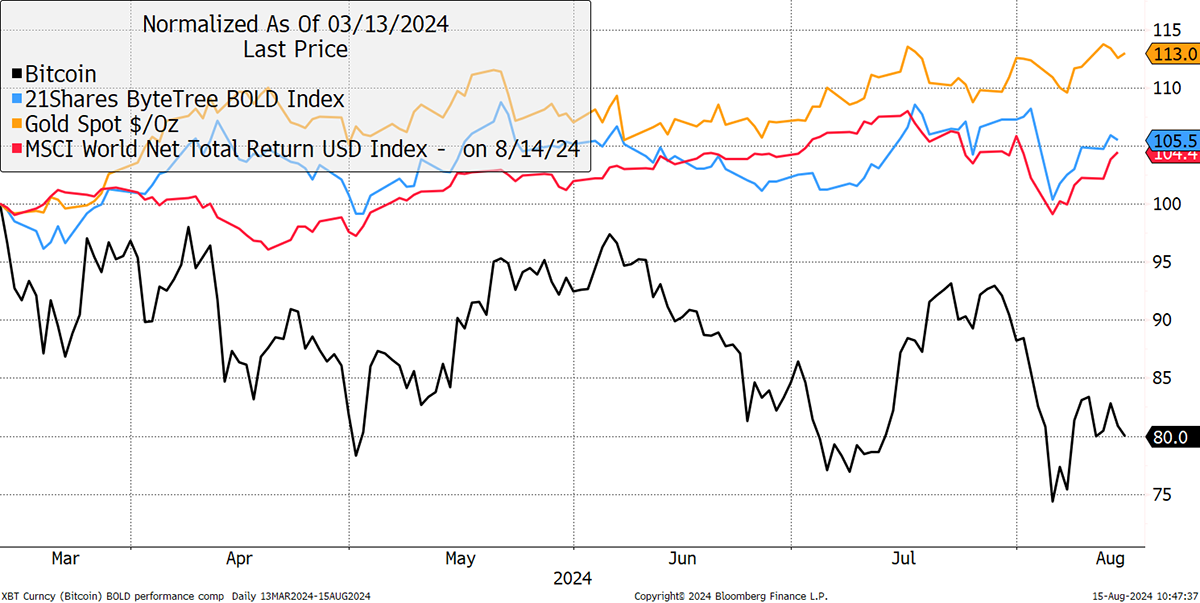
Bitcoin is down 20% since the high in March. The price is $58,500 yet ByteTree’s fair value remains a more upbeat $64,500. Bitcoin and Gold are partners and friends, which behave differently. Yet to love both assets, as I do, is so lonely. Wall Street, or mainstream finance, cares little for Bitcoin and Gold because there are not many ways to charge high fees. Bitcoiners think Gold Bugs are Luddite Boomers, while Gold Bugs think Bitcoins are deluded teenagers.
That’s why the BOLD club is so small, but my aim is to change that as it is too good to ignore. The hype around halving and the US Bitcoin ETF launches saw the price peak on 13 March. Since then, Gold is up 13%. While BOLD can’t keep up with Gold, with Bitcoin down over a short horizon, it’s still up 5%, which beats global equities, including dividends, up 4%.
Bitcoin, Gold, and BOLD Since the 13 March High
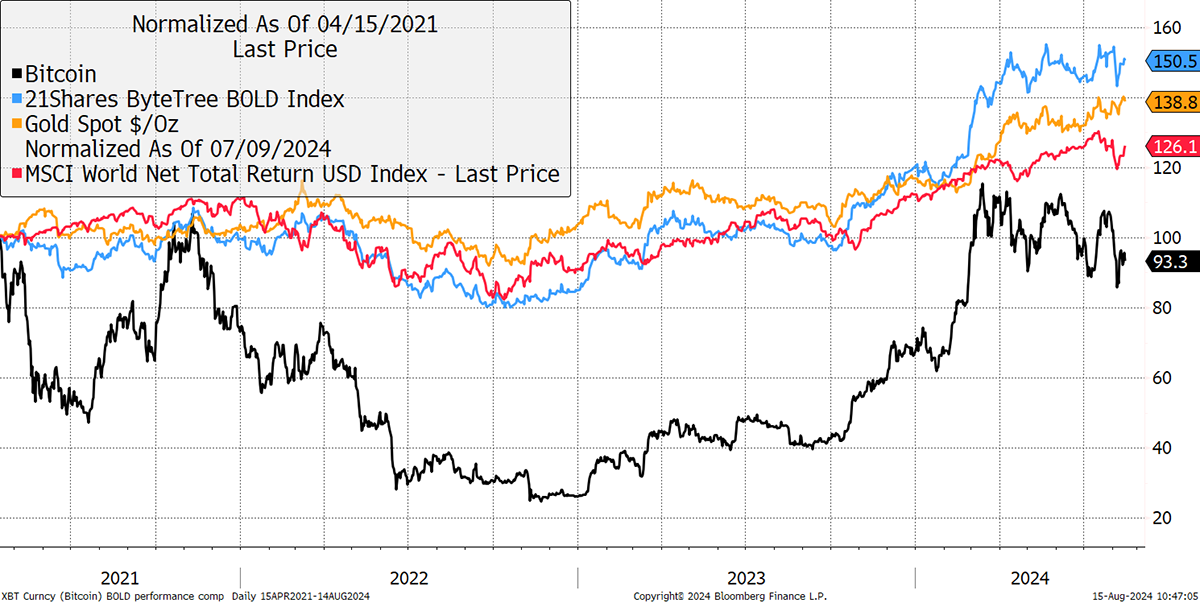
And, since the April 2020 Bitcoin high, BOLD is up 50%, better than Gold and way better than Bitcoin. It even beat the stockmarket by 24%. What’s more, Bitcoin will perk up again sooner or later, and that will fuel BOLD even further!
Bitcoin, Gold, and BOLD Since the 15 April 2021 High
Obviously a strong Bitcoin will outpace all, but to buy the lows is a complex and risky business. In contrast, BOLD is a calm buy-and-hold asset mix, requiring zero thought, luck or skill. The BOLD Report website has lots of information and publishes the monthly weights free of charge. At ByteTree, we are here to help. You can contact us at bold@bytetree.com.
Summary
It is remarkable that macro managers are bearish gold because they think it’s a crowded trade. Far from it, gold positioning is still in 2013, when debt and money have surged since. Gold is on solid ground, and it is spooky how this rally is so quiet.
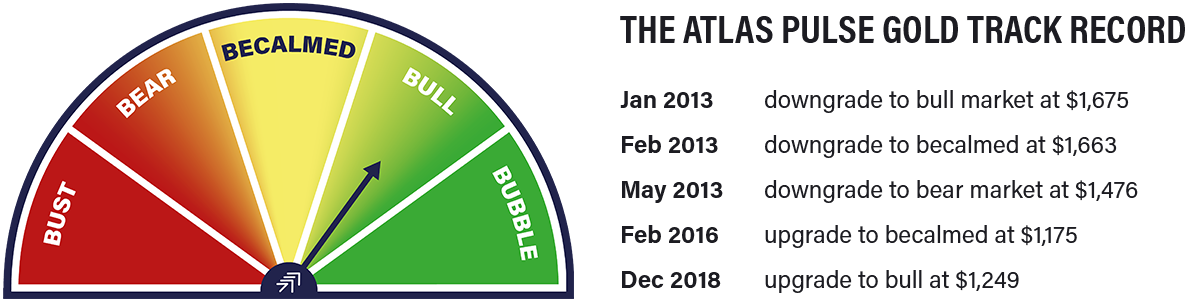
Thank you for reading Atlas Pulse. The Gold Dial remains on Bull Market.
Charlie Morris is the Founder and Editor of the Atlas Pulse Gold Report, established in 2012. His pioneering gold valuation model, developed in 2012, was published by the London Mastels Bullion Association (LBMA) and the World Gold Council (WGC). It is widely regarded as a major contribution to understanding the behaviour of the gold price.
Please email charlie.morris@bytetree.com with your thoughts.
