My Journey in Finance: How to Build a Momentum Fund

My Journey in Finance: How to Build a Momentum Fund

Disclaimer: Your capital is at risk. This is not investment advice.

Last week, I kicked off this new series by introducing why momentum works. Please have a look at Why Momentum Works before you carry on.

To build a global momentum fund, you can’t look at every stock in the world; you have to cut that down to size. Too many stocks in your universe will lead to too many stocks in your portfolio, and “diworsified” portfolios don’t perform.

Bearing in mind that you want the stocks to be liquid and easy to trade, a good starting point is to cut down the universe to a workable number of companies, such as the 1,416 constituents of the world index. Using an index is helpful because the index company brings in new companies and ejects old ones, keeping the investment universe up to date. Having a universe like this is one less thing to think about.

Alternatively, you could choose a single country or region, such as the S&P 500 or the EuroStoxx600. That’s fine, but in the 1980s, the market leadership was dominated by Japanese companies, and in the noughties, it was in the emerging markets. Narrowing the geographic reach too much can mean the strategy misses the greatest of trends. I would try to keep it global.

You then find a data source for historical share prices, adjust them where necessary (share splits, corporate actions, dividends etc.), convert them into the same currency and measure them against an index, such as the world index. Keep the price data and the index in the same currency, and the US dollar becomes the obvious choice. But it wouldn’t matter if you chose the Turkish Lira or anything else, provided both the companies and the index were measured in the same way.

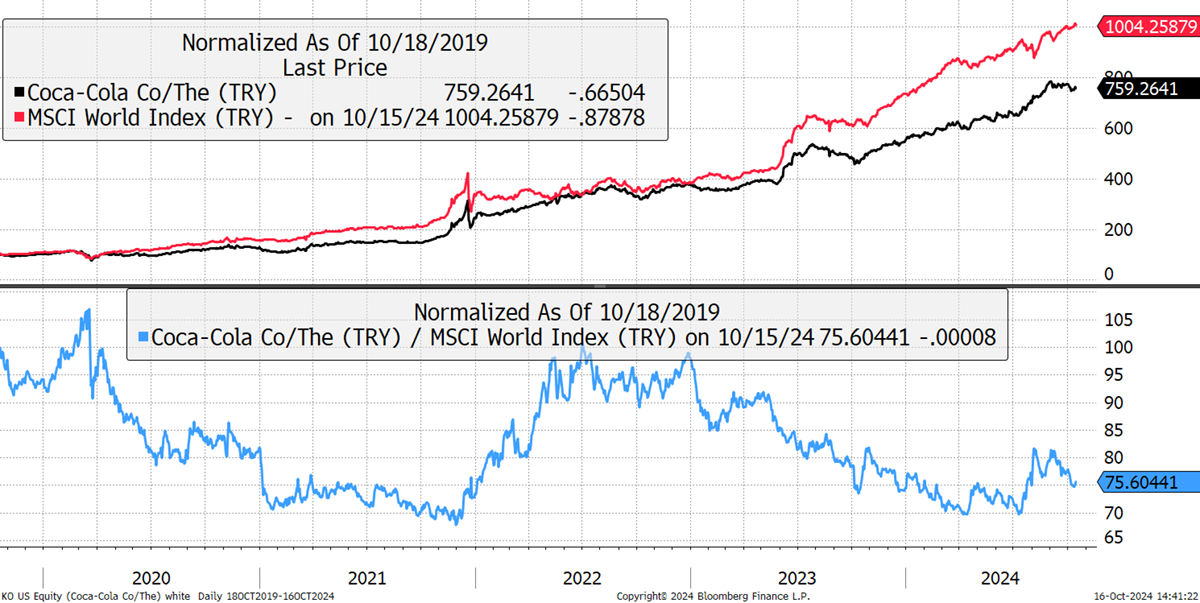
For example, Coca-Cola (black) and the world index (red) in Lira show both up 10x and 7x due to the weak Lira, but Coca-Cola has lagged the world, being 75 (blue) after five years.

Coca-Cola, World Index in Turkish Lira

Source: Bloomberg

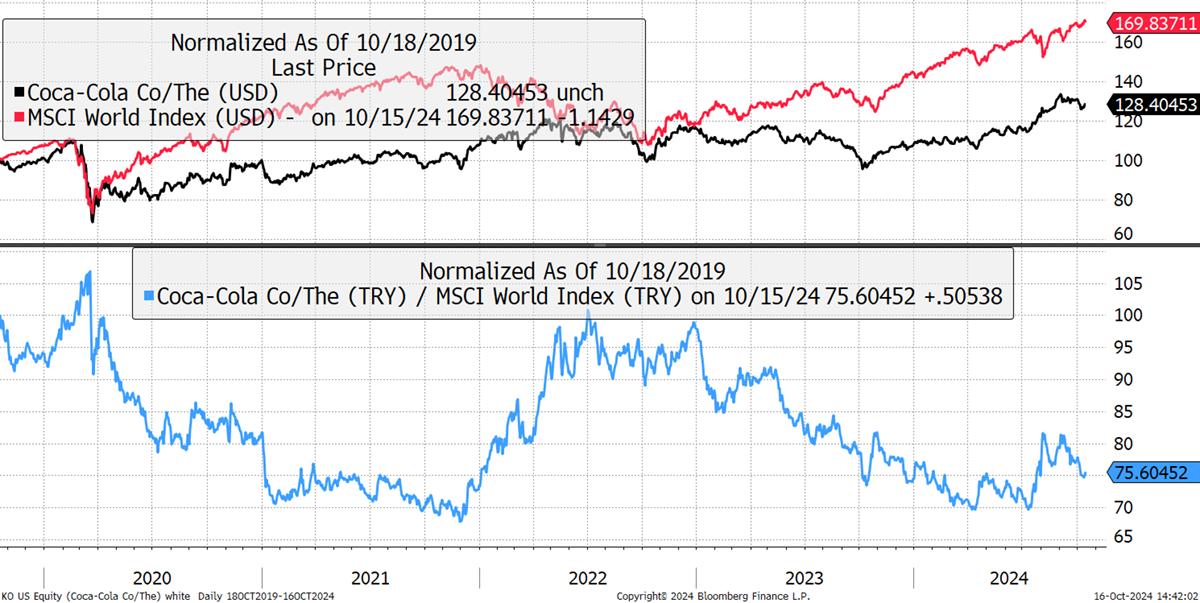
Repeating the same exercise in US dollars, Coca-Cola (KO black) and the world index (red) in USD show both up 70% and 28%, which is up by much less due to a stronger US dollar. Yet, the blue line, the price relative, is identical in both cases, at 75. This is an important point because “price relative” is a ratio and is the same in every currency. What is crucial is that the stocks and the index must all be measured in the same currency, but it doesn’t matter which one.

Coca-Cola, World Index in Turkish USD

Source: Bloomberg

Given that trends can change so much by currency, the focus is on the blue line, the price relative. Our global trend fund is searching for the strongest trends wherever they can be found. The example of KO shows a stock that has lagged the market over five years. Since the blue line reads 75, KO has underperformed the market by 25%.

Being a defensive company selling soft drinks, it outperformed the stockmarket in 2022 (blue line rising) when the market was falling. That is another way of identifying defensive stocks, as they have a habit of doing well, when things are going badly, and many fund managers have made a living out of embracing defensive stocks. A discussion for another day. The point is that KO does not currently have relative strength, so it will not be a candidate for this exercise. Perhaps we can find something that is.

NVIDIA

Here’s a well-known market leader, the AI chip maker NVIDIA (NVDA). It floated in 1999, and $100 invested back then would today be worth $343,000. The price relative is currently strong, but over three decades, it has come about in three stages.  

Stage A saw NVDA rise 16-fold over 35 months. Stage B saw it perform in line with the market for 164 months (13 years, 8 months), and stage C, over 100-fold over 11 months. Trend followers would have captured the relative strength in stages A and C, but hopefully didn’t waste too much time in stage B. Don’t forget this blue price relative line is excess return, which means the return in addition to the market return.

NVIDIA Relative Strength

Source: Bloomberg

Would you be shocked to learn that NVDA fell 54% over 33 days between 13 March and 14 April 2000?  It did just that before recovering quickly to a new high in May. In June, it collapsed again by 67% and then again by 51% the following summer. If that wasn’t enough, in 2002, NVDA fell by 89.7%, yet the price was still higher than in 1999. That must be one of the most extraordinary rollercoaster rides in the history of financial markets.

NVIDIA Volatility

Source: Bloomberg

What is a trend follower to do with volatility like this?

NVDA had volatility averaging 100% in the period shown above, roughly equivalent to Bitcoin in its early days. Many investors embrace stop losses, and I can sympathise with that, but it is important to consider volatility. If the volatility is this high, the position size becomes much more important than the stop. With volatile situations, it can pay to hold a smaller position and stand back. We’ll come back to this point later.

Of course, you only ever read in the papers about those that went all into the big winners. You never hear much about those who backed companies with all they had that ultimately failed. The point about trend-following is that you can end up holding the winners, without consulting a crystal ball, just by following a process.

The NVDA bulls would have been buying a growth stock, and its sales (green) have grown significantly over the years. In 1999, they had quarterly sales of $65.5 million, and just after the 89% fall, Q3 2002 was reported at $365 million. Sales did well into 2003 at $582 million but didn’t make a new high until 2006.

The price-to-sales ratio (PSR), the company's market cap or valuation compared to its revenues, is a simple way to show how much the stockmarket is prepared to reward NVDA for its sales. In the early boom stage A years, the PSR was 5.7x. In stage B, it was 2.5x. In stage C, it was 10x, then 25x and today, 34x. Today, the market is much more excited by NVDA than it was when it was a youthful growth stock 25 years ago. Odd, isn’t it? It is clearly harder for NVDA to grow by many multiples today than it was then, yet today’s rating is as high as it comes.

NVIDIA Price-to-Sales

Source: Bloomberg

There’s one more thing I should mention, which is in NVDA’s favour. As the company has grown its sales, it has also increased its profit margins as volumes and prices have risen faster than costs. Gross margins were around 40% pre-2008, and these days are closer to 75%. That would certainly justify a higher PSR. Still, this high?

In analysing why the NVDA stock is thousands of times higher over 25 years, some of the returns are due to revenue growth (25% p.a.), some to higher margins (40% to 75%), and the rest down to the share price (41% p.a.). The first two points are a result of the company’s actions; the third is not. Yet none of this needs to matter to a pure follower of price trends, but I believe that awareness of the underlying fundamentals is essential. The trend follower lives for the premium.

For trend followers, the chart that really matters is the relative strength, the relationship between a stock and the overall market. This time, NVDA is smoothed with a 12-month moving average, which highlights the long-term trend.

NVDA Price Relative Trend

Source: Bloomberg

There isn’t just one company like this but many. A quick screen around the world brings up Ferrari (RACE), Rolls Royce (RR), Oracle (ORCL) and hundreds more. This is why it is important to limit the size of your universe in a momentum fund, as too many stocks soon get complex and time-consuming.

More to the point, NVDA was a small-cap on its IPO in 1999. The performance was great, but the volatility was horrendous. Then it calmed as a mid-cap until 2015, when performance stalled, before becoming a highly liquid large-cap. Active traders depend on liquidity, so it’s easy to see how and why they focus on large-caps.

Crunch the Data

To identify the trends, you’ll need to use spreadsheets or, if more advanced, a programming language such as Python to crunch the data. You could also calculate other metrics such as volatility, liquidity, and a host of other technical measures. The key here is to use computers to save time, not create work. You also want to eliminate events, such as takeover bids, which, to the lazy computer, will show up as a trend.

Allocation

It doesn’t matter whether you have a thousand dollars or a billion dollars; you only have 100%. That 100% must be divided across many different stocks and periodically rebalanced. The final answer cannot exceed 100%, or you’ll run out of money, and it shouldn’t be much less because you’ll have cash drag. A small amount of cash is fine.

Before you start writing deal tickets, there are important decisions such as how frequently the portfolio will be rebalanced (daily, weekly, monthly, quarterly, half-yearly) and what rules would apply to position sizing (market cap, equal weight, risk/volatility-weight, etc.). What started as a simple exercise, seeking stocks that are leading the market, soon requires skill in coding and financial maths.

The stock weights are important. If you want to sell your fund to institutional investors, go for market cap because the tracking error will be relatively low, and no one will lose their job if things go wrong (career risk). Equal weight makes sense in momentum, provided there is time to run the winners. It’s a good option for high returns. Yet risk weight also makes sense because you’ll end up with less exposure to the craziest situations. That may dampen long-term returns but will probably increase your life expectancy commensurately.

Momentum investing works, not because a rising price will necessarily continue indefinitely; it won’t. It works because you repeatedly lock onto the winners, and it only takes a few to do the heavy lifting. So long as you have a steady stream of market-beating winners, the losers will no longer matter.

At times, there are many losers which will fall considerably, but they are a cost of implementing the strategy. Even if half of your stocks lose, most stay flat, but there’s a small gang of big winners, the portfolio will perform. Think about it: $100 invested can rise to infinity, but a losing stock can only fall to zero. Just try not to have too many stocks fall to zero at the same time.

A Week at ByteTree

Speaking of trends, Bitcoin is back. The ByteTrend score is 4 of 5 and heading for a new all-time high. I have been covering this in ByteFolio, making the point that this is No Time to Be a Doubter.  

Bitcoin Back on Track

Source: Bloomberg

Rightly or wrongly, I have concluded that the recent rally in Chinese stocks is an opportunity to take profits. I covered this in more detail in last week’s update of The Multi-Asset Investor but acted this week.

It was the same for Venture, where we took profits in JD.com.

I also released a note on Digital Value (DGV), where there’s been a mishap as the chairman has had to resign. This leading Italian software company had all five analysts as determined buyers last week before an official investigation came out of the blue. I might have said DGV was one of the world’s most undervalued software companies last week. Following the savage fall in the share price, it almost certainly is now. Yet these situations bring uncertainty because it’s now in the hands of government agencies. One agency approved one of their acquisitions last week, while another launched an investigation. It’s a harsh reminder, if you ever needed one, that diversification is the only free lunch in investment.

Have a great weekend,

Charlie Morris
Founder, ByteTree


Money Week Summit

On Friday, 8th November, I will be speaking in a panel on gold at the Money Week Wealth Summit with Adrian Ash from Bullion Vault and Dominic Frisby, the comic legend and gold bug.

Money Week has very kindly provided us with a code for 20% off on tickets! To buy a discounted ticket, please click the button below and add code BYTETREE20 at the checkout.