This series introduces my experiences with momentum investing. I kicked off with Why Momentum Works and, last week, How to Build a Momentum Fund. Please take a look at these before you continue.
There are many effective equity investment strategies such as quality (great companies over the long term), value (undervalued companies that get re-priced) and events (a catalyst for change). They all have their merits, and I intend to cover these areas and more, but momentum is a hot topic, and that’s why I’m covering it first. At times it can be powerful, but at other times, brutal.
The reason the winning stocks can be so powerful is that investors can smell growth, which causes the shares to rise. It then sees more growth, and a positive feedback loop ensues. George Soros called this his Theory of Reflexivity. Most of us call it a bubble because, eventually, it will burst. But as Soros famously said, “If I see a bubble forming, I rush in to buy.”
In a go-go market, a company’s share price can rise faster, sometimes much faster, than the company’s growth. The idea is that should the growth continue, the shares will be worth much more in the future, so why wait until then, when we can bid them up now? It is the same school of thought that gives the leading strikers an inelastic valuation (see part 1) while ignoring the price paid per goal. Or, in Buffett-speak, the voting machine versus the weighing machine.
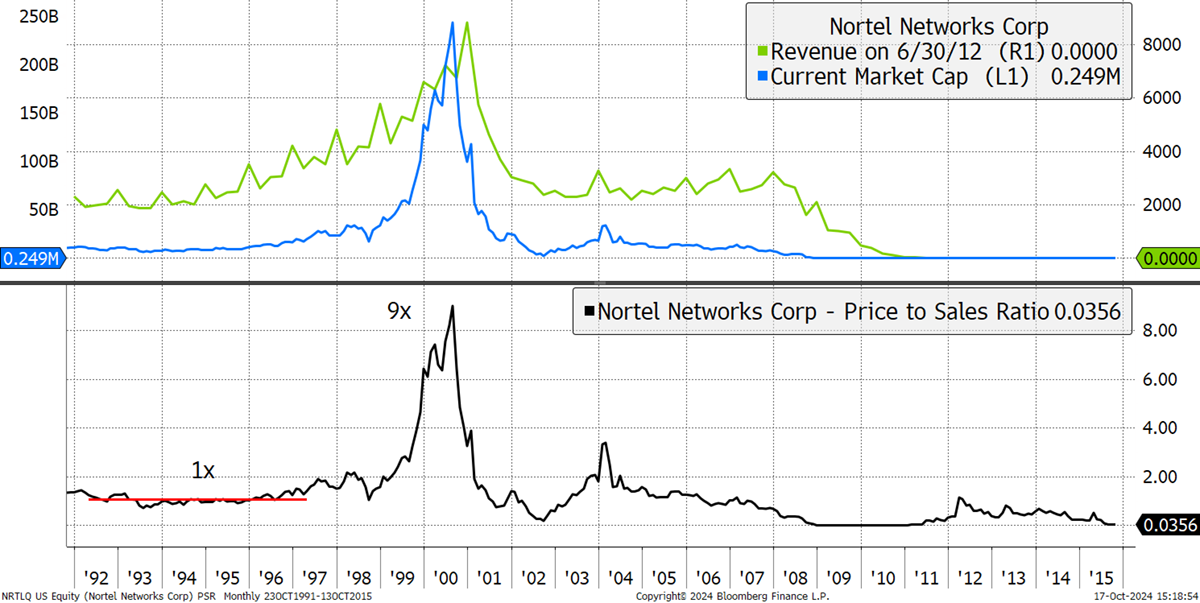
I will go through a few examples of some of the challenges that a well-managed momentum fund faces. Canada’s Nortel Networks was a good example. In the year 2000, it was briefly worth $243 billion, making it one of the most valuable companies in the world at the time. It didn’t grow in the early 1990s, but then in 1995 it delivered 20% growth for the next three years, and then the fun began. It had acquired Germany’s Bay Networks in 1998, a competitor to Cisco, and the market went wild. At the time, servers were all the rage because they enabled the internet.
The lower line (black) shows Nortel’s price-to-sales ratio (PSR). It traded at 1x sales in the mid-1990s, only to surge to 9x sales by 2000. Then sales fell as the internet boom stalled, and the scramble for the exit was painful, with a 33% drop in February 2001 in a single trading day. It demonstrates how things can change quickly.
The Nortel Boom and Bust
Nortel was delisted in 2015, having destroyed all of its equity capital. Yet savvy momentum investors could have picked up on Nortel in the late 1990s, as the price took off, and exited before the collapse. I can illustrate that with ByteTrend using a score of 5 for a buy and a 0 for a sell; a simple implementation of the strategy.
Nortel Price Trend
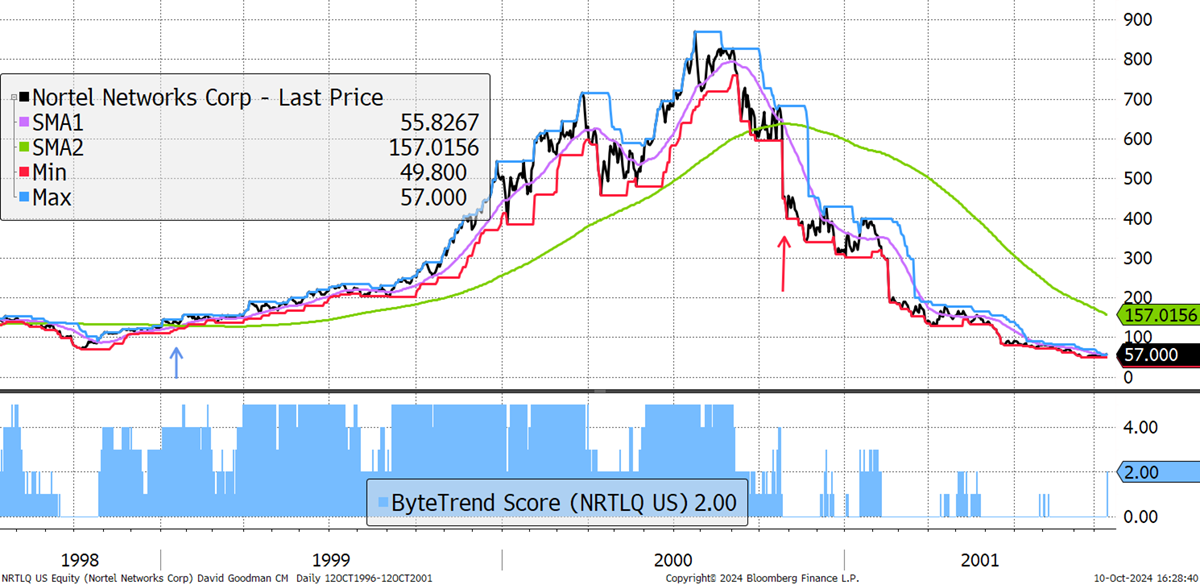
There are other ways to implement this such as buy 5, sell 2 or sell 1, but to keep it simple, I’ll start with buy 5, sell 0. If you are unfamiliar with ByteTrend, please see our guide.
An improvement would be to use price relative instead of price, as I explained in part 2. That is the price measured relative to the stockmarket; an index such as the S&P 500 or the World. The chart becomes much cleaner, and much of the volatility disappears. By dividing the price by the market price, much of the day-to-day market noise disappears, and what’s left is whether the stock is doing better or worse than the market. With price relative, the ByteTrend score is more consistent and easier to interpret. On this occasion, the entry and exit points were similar, but at least the actions were more decisive and less open to interpretation.
Nortel Price Relative Trend
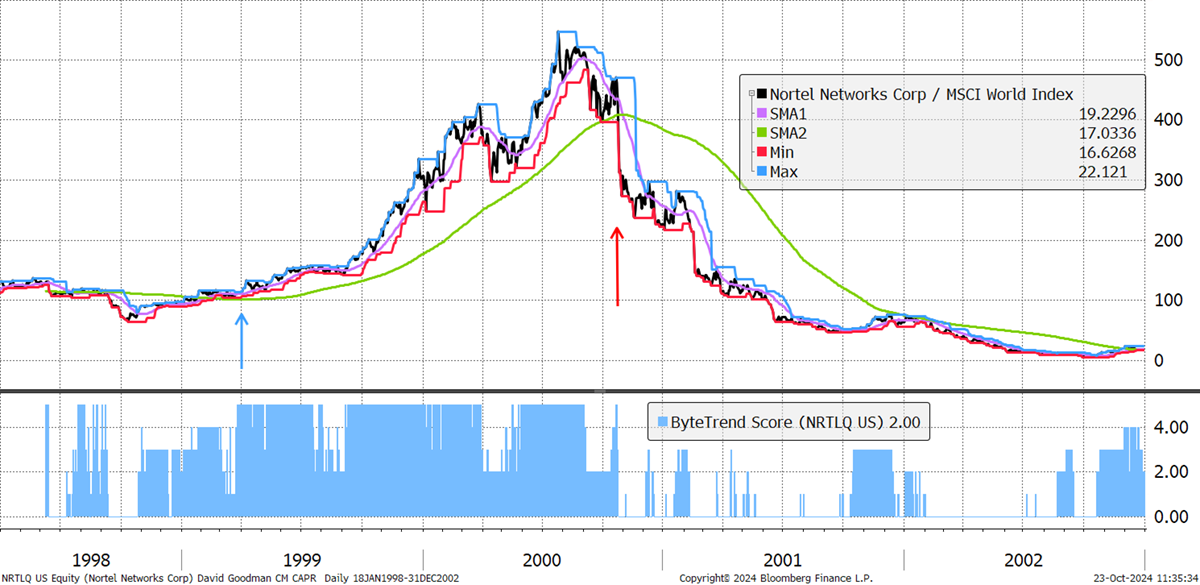
This is an extreme situation. On the way up, all is well, but the way it cracked on the way down was horrendous. Nortel was a $243 billion mega-cap stock behaving like a volatile mid-cap. Back then, this was a lot of money. I believe the world’s most valuable company at the time was Microsoft, worth $600 billion, closely followed by GE ($580 billion), which briefly held the lead. Nortel was up there (not shown due to lost data).
Trillion-Dollar Companies
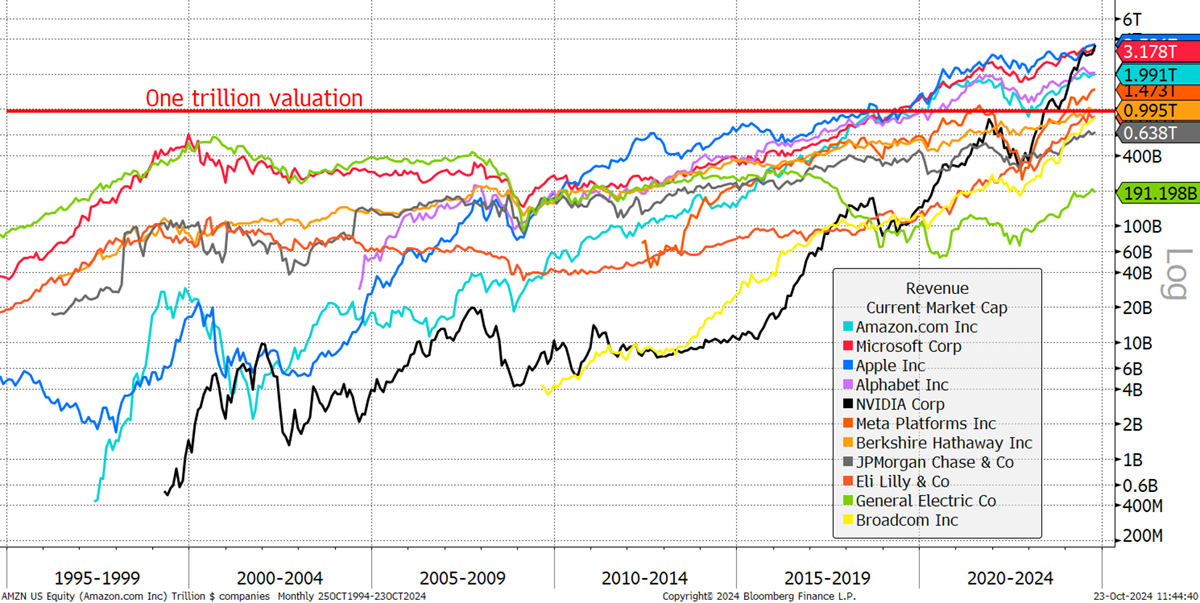
The trillion-dollar companies never came to be in the dotcom bubble and had to wait until 2018 when Apple finally broke the glass ceiling. Today, there are six or seven trillion-dollar companies (it keeps changing) in the US, plus Saudi Aramco (not shown), which sits on vast oil reserves. There are none from China, Japan or Europe, where the most valuable companies are Tencent ($501 bn), Toyota ($431 bn), and Novo Nordisk ($538 bn), respectively.
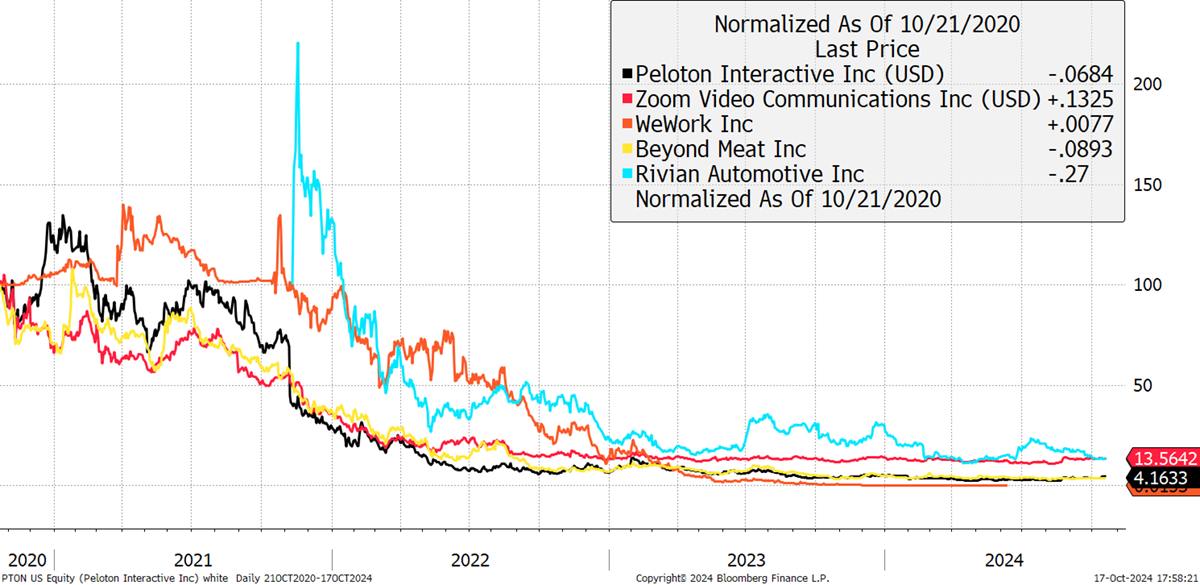
By executing a trend-following strategy, momentum investors end up owning these valuable stocks, as is highly fashionable today. But for the few that made it to the top, consider the hundreds of companies that failed. There is no shortage of examples, which may still be ongoing concerns, but the outcomes for investors have been a wipeout. For example, Zoom is highly profitable, making profits of $1.7bn per year, yet the share price still collapsed. WeWork, on the other hand, is dead and buried. I show some examples from the 2021 stockmarket bubble. Many companies slumped by 70%, 80%, 90% or even 95%. It was a shambles.
Big Names that Didn’t Make it
Most importantly, a trend-following strategy isn’t about a single company but about the market leaders, of which, at any given time, there are many. That remains true whether the market is rising or falling.


