This series introduces my experiences with momentum investing. I kicked off with Why Momentum Works, then How to Build a Momentum Fund, and last week, Riding the Escalators. Please take a look at these before you continue.
So far, we have covered the basics of momentum investing, a form of trend-following that focuses on the market leaders. Over the long term, it is a strategy that has beaten the market handsomely, but not without fright. In this piece, I shall show you what happens when it all goes wrong.
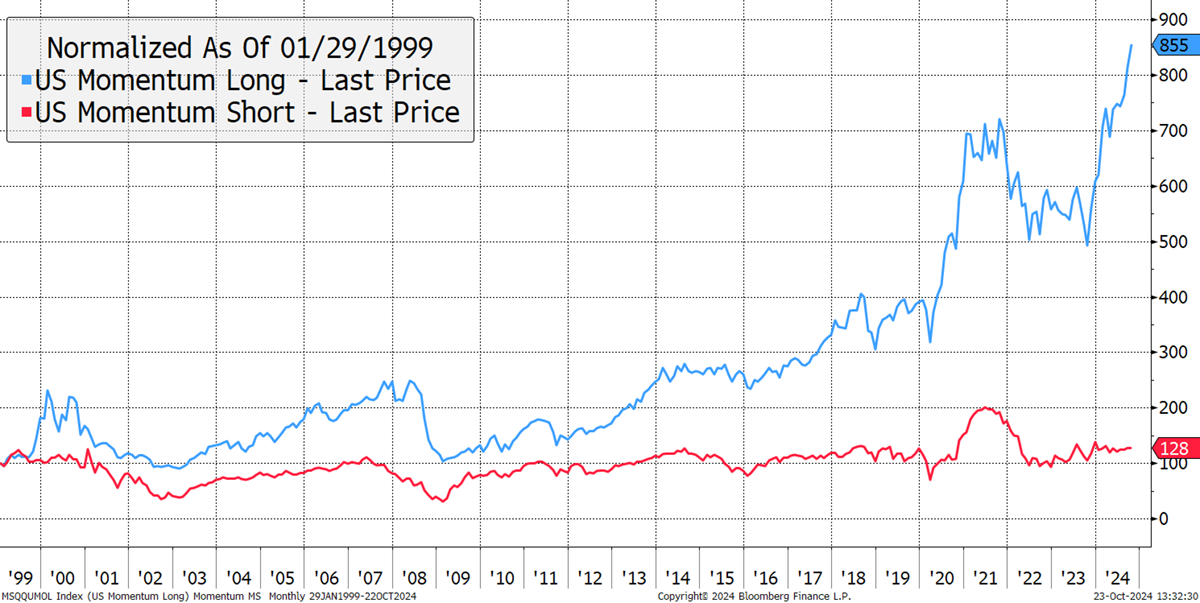
Not only does the market have winners, the best-performing stocks (blue), but it also has losers, the worst-performing stocks (red). There are important lessons from both groups. The winners are measured by past 12-month performance (with filters), and the losers are the stocks that fared the worst. In recent years, Morgan Stanley created indices to measure this, and I show them from 1999.
Past Winners and Losers

These indices were created after the credit crisis, and I would guess in or around 2015. That means the data calculated beforehand was a backtest, intended to recreate the past. In my opinion, the dotcom boom and bust from 1999 to 2002 is likely understated by this data, as many stocks went to the moon and back (Pets.com and so on). It certainly felt crazier at the time than this data shows. I am not criticising the data, merely stating how difficult it is to get accurate historical market data, especially in the olden days. These days, record-keeping is much improved. As a result, I think the last ten years, which used actual market data, are likely to more accurately reflect the momentum effect in the US stockmarket.
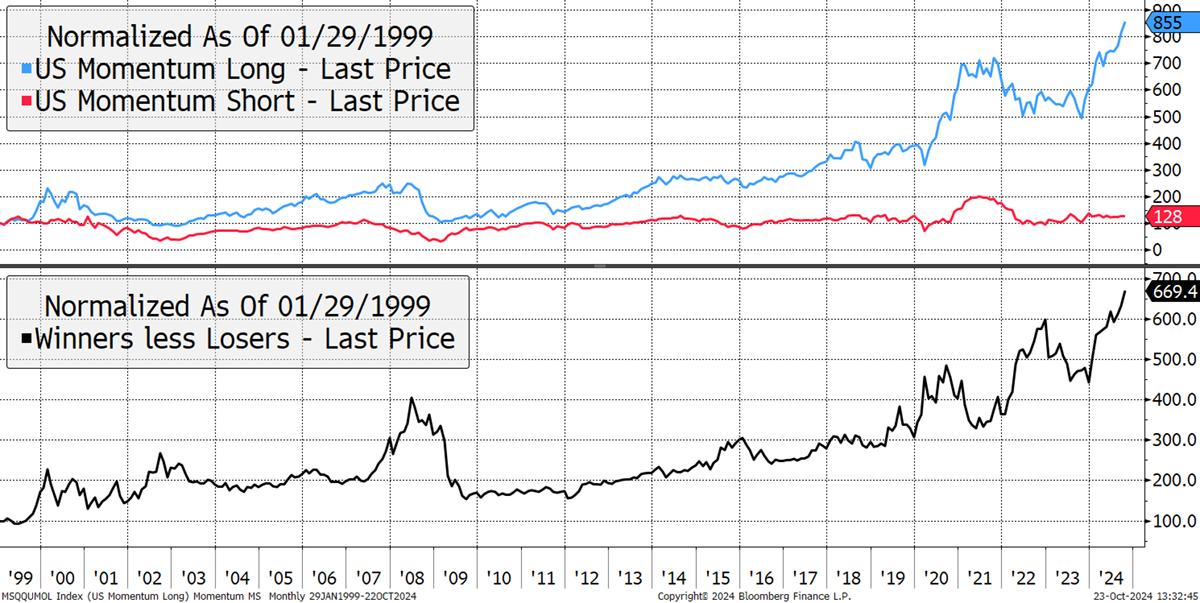
The winners have beaten the bull markets but, on occasion, they have suffered great losses. The losers never seem to do much but spring to life during the momentum crashes. The lower black line shows the difference between the winners and the losers and measures the momentum effect (momo). That is essentially what a hedge fund that bought the winners and sold the losers short would look like.
The Winners Don’t Always Win

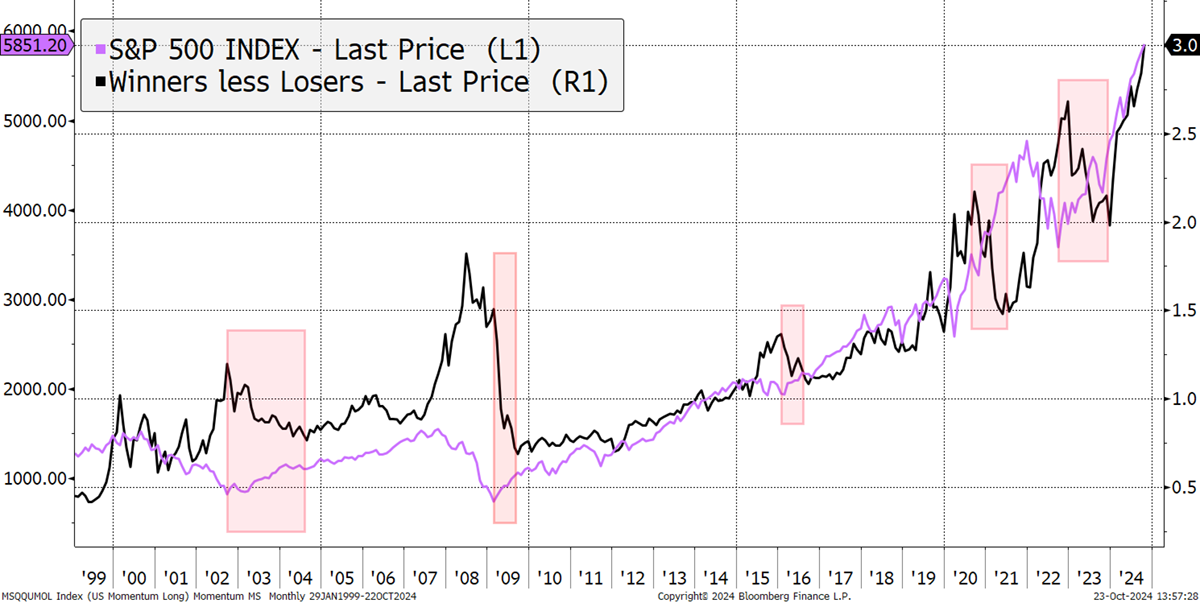
I highlight this by looking at momo and the market (S&P 500) together. The key point here is that when the market emerges from a bear, the momo crashes, as highlighted. This happened in 2002, 2009, 2016, 2020 and 2022.
Five Momentum Crashes

What is typical is that the winners offer sanctuary after the bear market begins and offer shelter during the market fall. Then, when the market finally bottoms, the losers lead the rally while the winners stall. The reversal of momo can be dramatic and sudden. Investors holding the winners at the time, proud of their outperformance during a bear market, complain that the “trash” is rallying, and it isn’t right. What’s happening is that the losers are heavily oversold compared to the market, while the winners are crowded. The market normalises, and that’s the set-up for a momentum crash.
This is a fabulous time to buy the past losers, as The Multi-Asset Investor clients have experienced several times. It is the safest time to buy oversold value stocks with ugly price charts. The rally starts with short covering before continuing as the economy starts to improve. All the while, the old winners remain crowded and fail to participate in the rally.


