Resistance at $100k
Disclaimer: Your capital is at risk. This is not investment advice.
ByteFolio Issue 137;
I showed this chart two weeks ago, and with resistance at $100,000 for Bitcoin, it’s still important, so I show it again.
Bitcoin Price with Round Levels
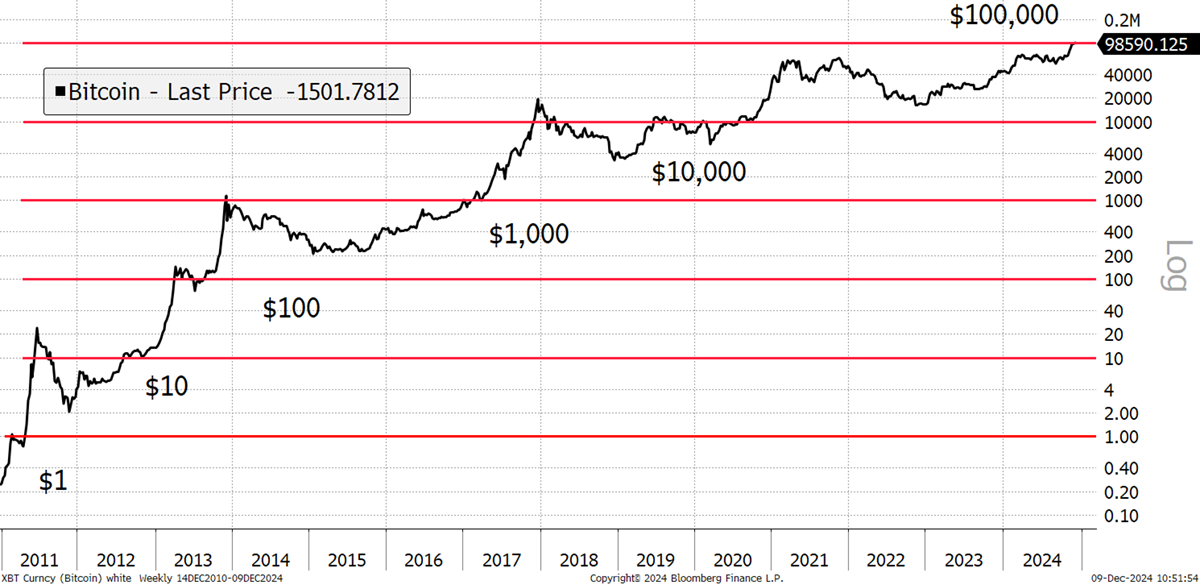
Big round numbers are a real thing and often take time to overcome. Previous Bitcoin milestones all saw a stall, some for three years.
- $10 in June 2011, with consolidation until November 2012.
- $100 in March 2013, with consolidation until October 2013.
- $1,000 in January 2017, with consolidation until March 2017.
- $10,000 in November 2017, with consolidation until October 2020.
$1,000 saw a touch and a revisit over three years later. $10,000 was broken in 2017, reversed, and then acted as an anchor until late 2020. This time, I suspect that Bitcoin will break higher but then revisit $100,000 later this cycle in the next crypto winter. Today $100k is resistance, but one day, it will become support.
The point here is that lofty expectations need to be curtailed because Bitcoin has entered the real money game. The megabucks will be made, but it will take time. In the fifth epoch, the miners’ reward is 450 BTC per day, down from 7,200 BTC per day in the first epoch (2009 to 2012). In 2028, that drops to 225 BTC, and by 2040, 28.125 BTC.
At 450 BTC per day at $100k, the miners earn $16.4 billion per year (plus transaction fees, so add another 11%). That money must come from network inflows, to maintain equilibrium.
Annual Flows Required to Sustain Bitcoin Price Level
| 2024 | 2028 | 2032 | 2036 | 2040 | |
| Block Reward BTC/Day | 450 | 225 | 112.5 | 56.25 | 28.125 |
| $50,000 | $8.2 bn | $4.1 bn | $2.1 bn | $1.0 bn | $0.5 bn |
| $100,000 | $16.4 bn | $8.2 bn | $4.1 bn | $2.1 bn | $1.0 bn |
| $250,000 | $41.1 bn | $20.5 bn | $10.3 bn | $5.1 bn | $2.6 bn |
| $500,000 | $82.1 bn | $41.1 bn | $20.5 bn | $10.3 bn | $5.1 bn |
| $1,000,000 | $164.3 bn | $82.1 bn | $41.1 bn | $20.5 bn | $10.3 bn |
Source: ByteTree
For Bitcoin to reach $500k this cycle, network flows would need to reach $82.1 billion, which is hopeful. That said, Bitcoin could touch $500k for a short period of time but is unlikely to sustain that level for long. Yet by 2032, the cost would drop to $20.5 billion, which is achievable. I deem Bitcoin to be a long-term growth asset, and the logical way to forecast the price framework is by understanding flows.
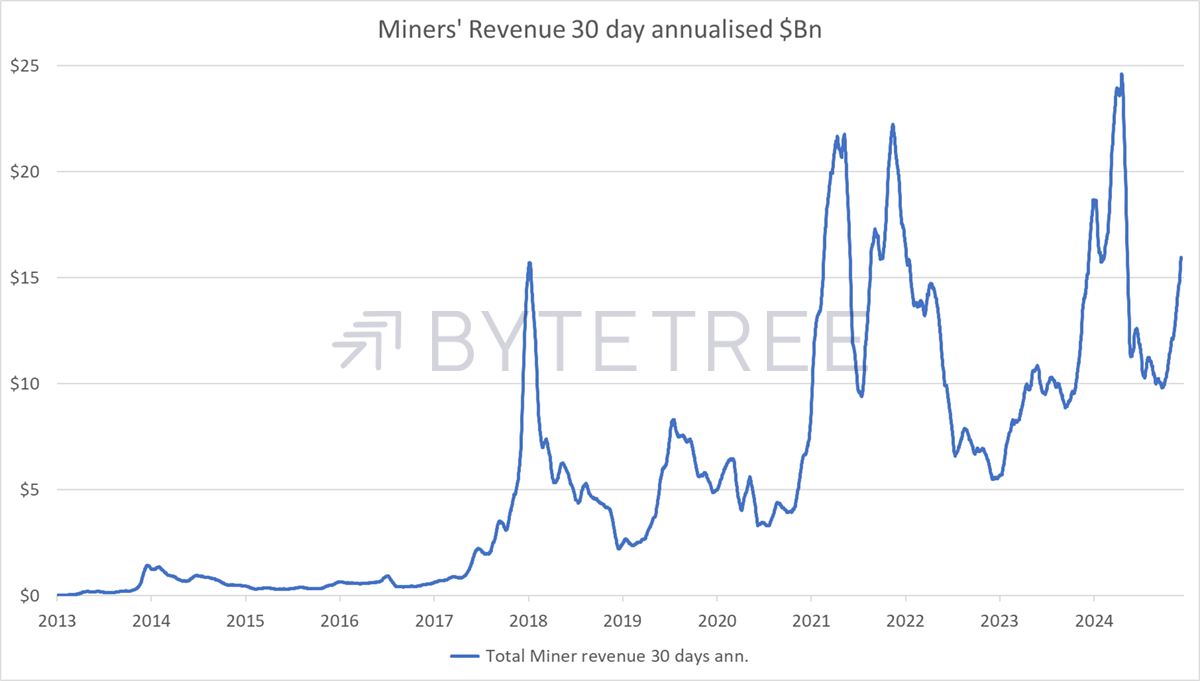
The blockchain data tells us exactly what the miners’ revenue has been in the past, not that all of it has been realised. But mining is expensive, and it is hopeful to believe the miners fully HODL. Looking at their revenue, the 2018 to 2020 era saw network flows around $5 billion per year. Since 2021, that has grown to an average of $11.4 billion. In 2024, it has grown to $16 billion this year and rising.
Bitcoin Miners’ Revenue
The point is that a future high Bitcoin price is relatively easy to imagine, but $100k is a number we should get used to because unless the flows can surge from here, that is where we’ll be spending time. The ETF flows are so important because this is a monetary network. This year, the Bitcoin ETFs acquired a net of 404,704 BTC, while 206,672 BTC have been mined. That implies the non-ETF flows have been negative as HODLers have been taking profits.
The Bitcoin ETF flows have continued to be solid, and to my reckoning, the wealth management industry is yet to turn up at the door. They’ll come, and Bitcoin will hit much higher prices, but it will take time.
Bitcoin Held by Global ETFs

That’s why it’s time for altcoin season. Bitcoin’s junior friends are having their moment. Our job in ByteFolio is to hunt down the winners.
