
Atlas Pulse Gold Report Issue 103;
The world is changing, and strategic investors are dumping the dollar in exchange for gold. In this issue, I revisit the crucial gold sentiment indicators and look at investor behaviour in gold, gold miners and silver.
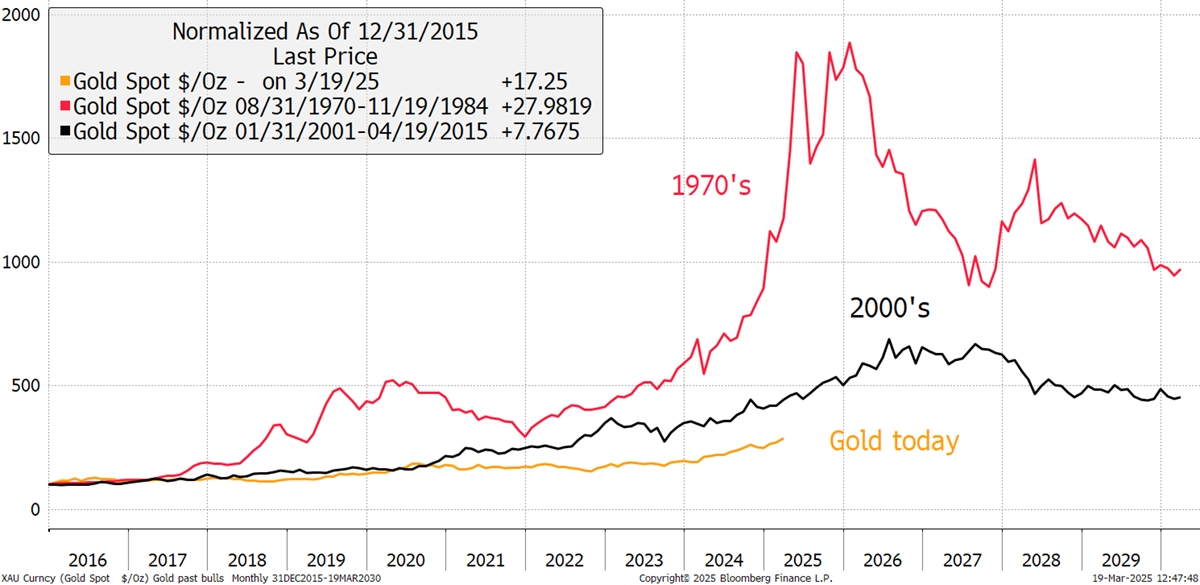
As gold breaks $3,000 for the first time, some investors are getting the jitters. The price has nearly trebled since the low in late 2015, delivering a solid 12% per year since. Trebled sounds like a lot, whereas 12% p.a. doesn’t. The gold move is tame compared to great moves of the past.
Nothing Compared to the Great Gold Rallies
In recent issues, I have discussed how we got here. In late 2018, the call was that real interest rates had peaked. That drove gold into the pandemic to be met by the largest tsunami of newly printed money in history. Just as inflation was settling down, geopolitics kicked in with the invasion of Ukraine, asset confiscation, and, more recently, Trump. In short, the world is changing, and strategic investors are dumping the dollar in exchange for gold.
There’s not too much new to say that hasn’t been said, but the important point is that this is a slow and steady bull market and not a euphoric move as the Financial Times would have you believe. It should be noted that the FT never liked gold much, as the establishment generally doesn’t. Alternative assets are unpopular with the elite because they sit outside of the nation state and don’t earn much commission for Wall Street.
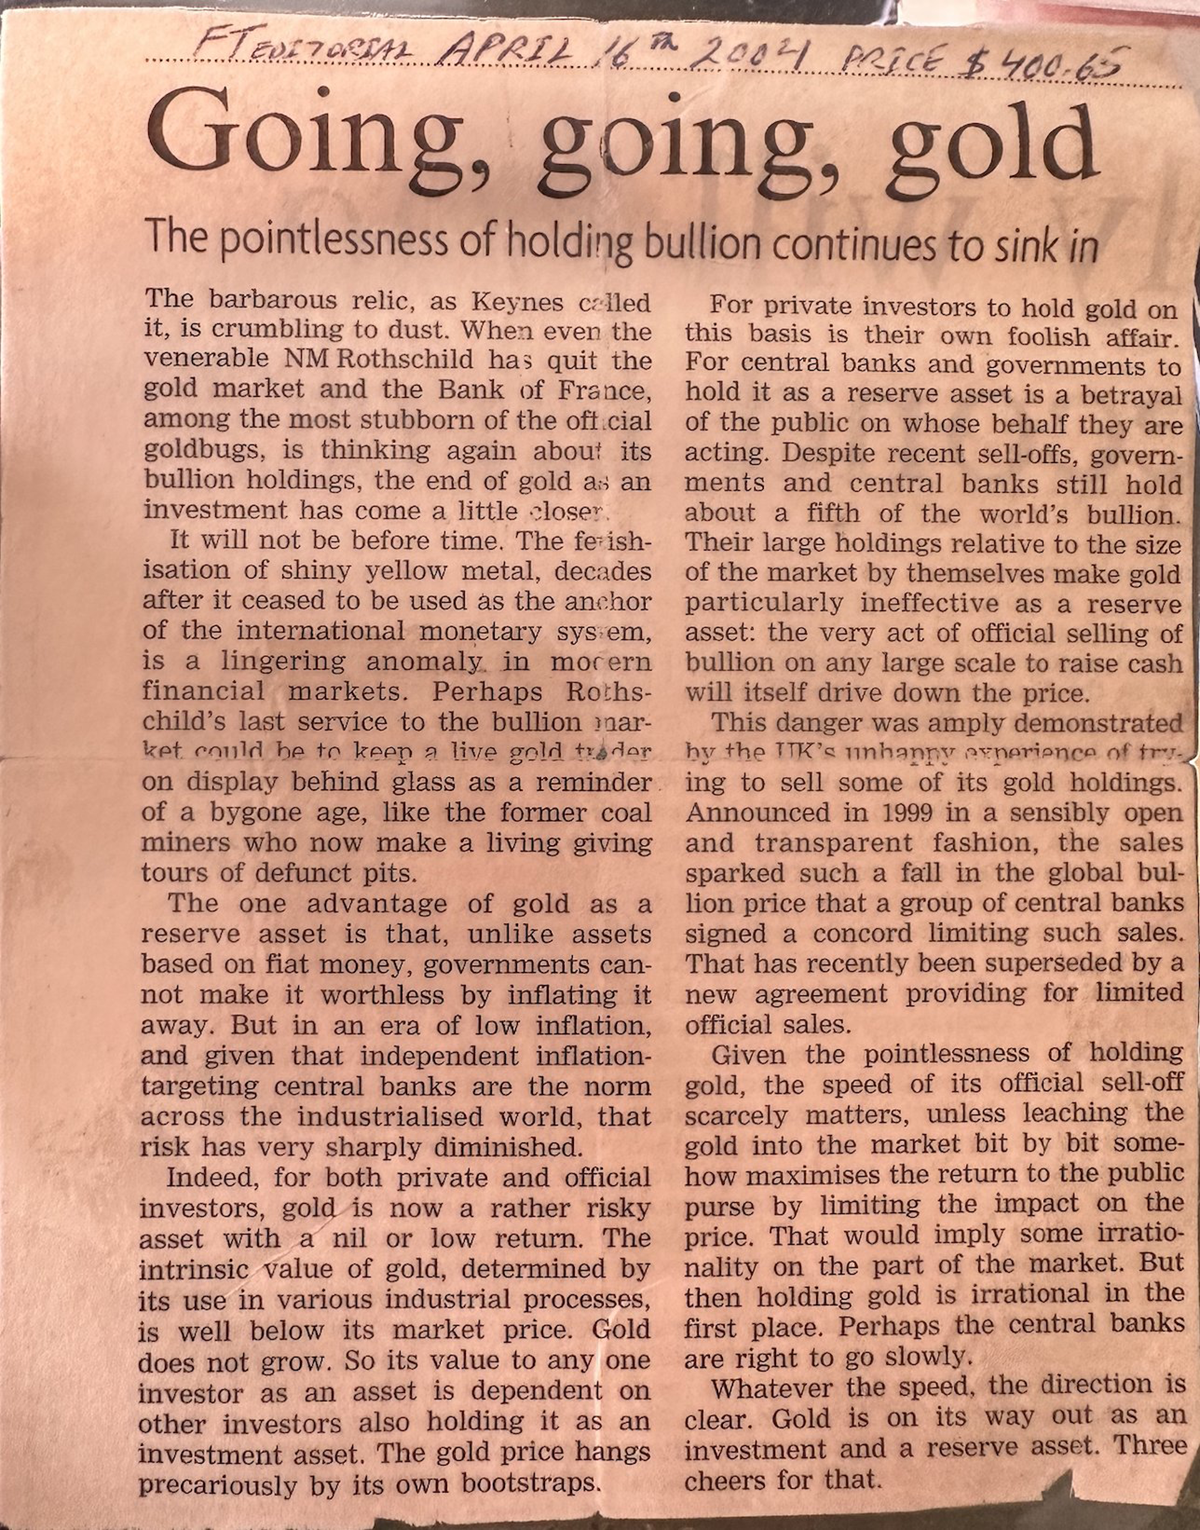
In 2004, the FT wrote an editorial about gold. Negative, of course. I liked the line, “Gold is on its way out as an investment and a reserve asset. Thank goodness for that.” The price was $400, and today, over $3,000. H/T @maneco1964
FT Editorial 16 April 2004
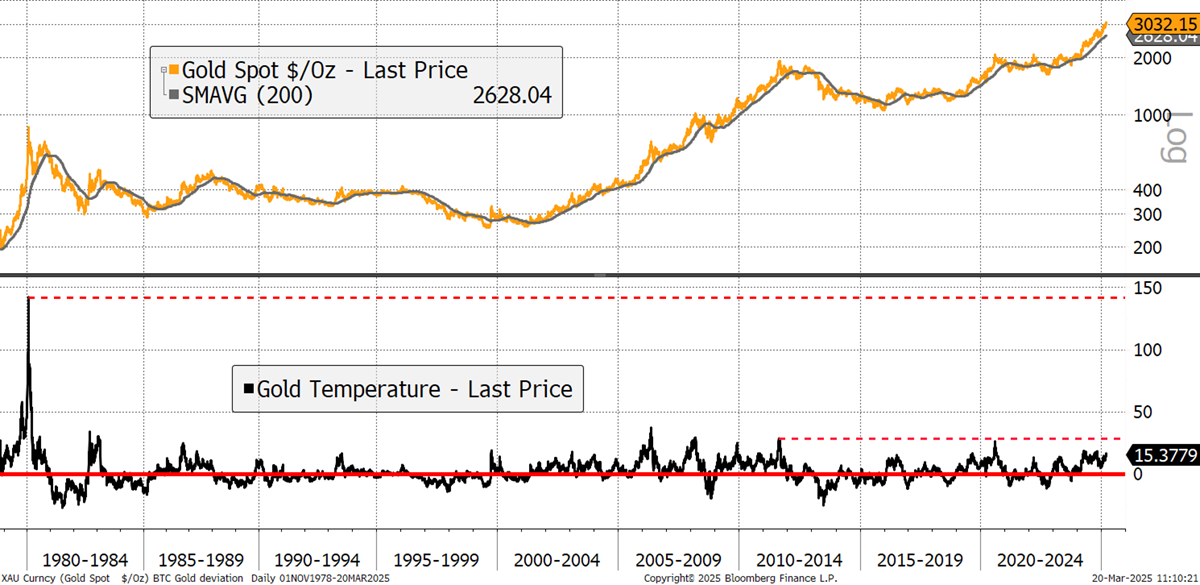
I want to show a few charts to demonstrate how the current gold rally is underpinned and a long way from danger territory. The first and simplest point is that the price of gold is not particularly overbought relative to its trend. I measure that with a deviation from the 200-day moving average and the current reading of 15%. That is, the price of gold is $3,030 and the 200-day moving average is at $2,624, so gold is 15% above it. At the 2011 peak, that was 28%, and at the 1980 peak, 140%. Gold is not overbought on this basis. It is displaying the signs of a healthy bull market.
Is Gold Overbought?
It is important to watch the alternatives to gold for clues as to when things have gone too far. Generally speaking, when the gold market is red hot, expect the price of silver and the miners to go wild. That hasn’t yet happened, which suggests we are not close to a market peak.
